 |
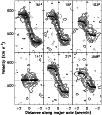
Figure 1: Example of an interactively determined rotation curve (solid points) fit to six position-velocity diagrams (contours), which were taken along the position angels indicated in the top right of each panel. The galaxy shown here is UGC 4325. To determine the rotation curve the position angle, the inclination and the rotation velocity were changed until the projected points on the position-velocity diagrams were found to best match the data. |
| Open with DEXTER | |
In the text
 |
Figure 2:
Comparison between the data for the receding side of UGC 12732,
shown in grayscale, and models of the observations (contours), based
on an input rotation curve and the observed H I distribution at
the full resolution. The input rotation curve is adjusted until the
best match to the data is obtained (shown in the middle panel). The
top panel shows the model based on the rotation curve derived by
visual inspection, which underestimates the rotation velocities in
the inner parts. The bottom panel shows a model based on a rotation
curve that overestimates the rotation velocities between the center
and 1
|
| Open with DEXTER | |
In the text
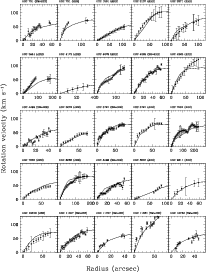 |
Figure 3:
Comparison of the H |
| Open with DEXTER | |
In the text
 |
Figure 4: Compilation of the rotation curves of the galaxies in the high quality sample. The left panel shows the rotation curves with radii expressed in kpc, in the right panel the radii are expressed in units of disk scale lengths. |
| Open with DEXTER | |
In the text
 |
Figure 5:
Logarithmic slope of the rotation curve between 2 disk scale
lengths and the last measured point
|
| Open with DEXTER | |
In the text
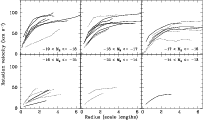 |
Figure 6: Rotation curves in bins of absolute magnitude with radii expressed in units of disk scale length. The full lines give the rotation curves of the galaxies in the high quality sample, the dotted lines those of the galaxies in the lower quality sample. |
| Open with DEXTER | |
In the text
 |
Figure 7:
Logarithmic slope of the rotation curve between 2 disk scale lengths
and the last measured point
|
| Open with DEXTER | |
In the text
 |
Figure 8:
Logarithmic slope of the rotation curve between 2 disk scale lengths
and the last measured point
|
| Open with DEXTER | |
In the text
 |
Figure 9:
Logarithmic slope of the rotation curve between 2 disk scale lengths
and the last measured point
|
| Open with DEXTER | |
In the text
 |
Figure 10:
Logarithmic slope of the rotation curve between 1 and 2 disk scale
lengths
|
| Open with DEXTER | |
In the text
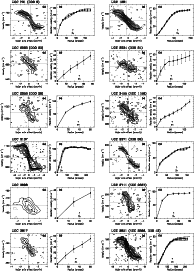 |
Figure A.1: |
| Open with DEXTER | |
In the text
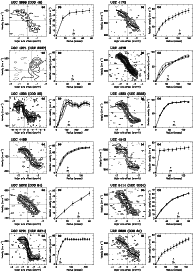 |
Figure A.1: continued. |
| Open with DEXTER | |
In the text
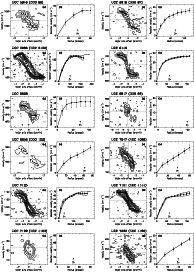 |
Figure A.1: continued. |
| Open with DEXTER | |
In the text
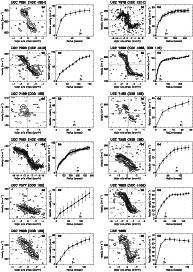 |
Figure A.1: continued. |
| Open with DEXTER | |
In the text
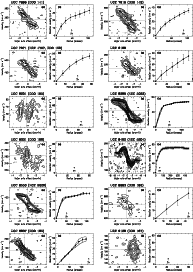 |
Figure A.1: continued. |
| Open with DEXTER | |
In the text
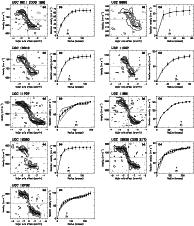 |
Figure A.1: continued. |
| Open with DEXTER | |
In the text