 |
Figure 1: Background-subtracted and pileup-corrected lightcurves for EQ Peg A ( top) and B ( bottom). Binsize for both sources is 600 s. |
| Open with DEXTER | |
In the text
 |
Figure 2: Chandra MEG spectra of EQ Peg A ( top, red) and B ( bottom, blue). Both spectra have been rebinned. |
| Open with DEXTER | |
In the text
 |
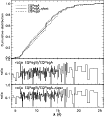
Figure 3:
Cumulative distribution ( top) of counts in the
MEG spectra of EQ Peg A (dotted line: all data, solid line: with the two larger flares on 28th November and December |
| Open with DEXTER | |
In the text
 |
Figure 4: Spectral region around the Ne X line at 12.13 Å and the Fe XVII and Fe XXI lines at 12.26 and 12.28 Å in the total spectrum of EQ Peg A. |
| Open with DEXTER | |
In the text
 |
Figure 5: The Ne IX triplet in the MEG spectra of EQ Peg A during the four observations. On observation No. 8485 the flare spectrum only is overlaid in gray. |
| Open with DEXTER | |
In the text
 |
Figure 6: Differential emission measures of EQ Peg A ( top) and B ( bottom) for the total observation time (i.e. flare and quiescence). |
| Open with DEXTER | |
In the text
 |
Figure 7: Line emissivity curves for different H-like and He-like ions, and Fe XVII at 15.01 Å from CHIANTI 5.2 (Landi et al. 2006) with the ionization balance from Mazzotta et al. (1998). |
| Open with DEXTER | |
In the text
 |
Figure 8:
Best-fit linear combination of the contribution functions of the H-like Ly |
| Open with DEXTER | |
In the text
 |
Figure 9: Cumulative distribution of counts in the quiescent spectra of the reference star Capella and other M dwarfs observed with the Chandra HETGS. The area between the curves for EQ Peg A and B is indicated in shades of gray for comparison. |
| Open with DEXTER | |
In the text
 |
Figure 10: Relative abundances as a function of spectral type derived from the seven M dwarfs as listed in Tables 7 and 10. |
| Open with DEXTER | |
In the text