 |
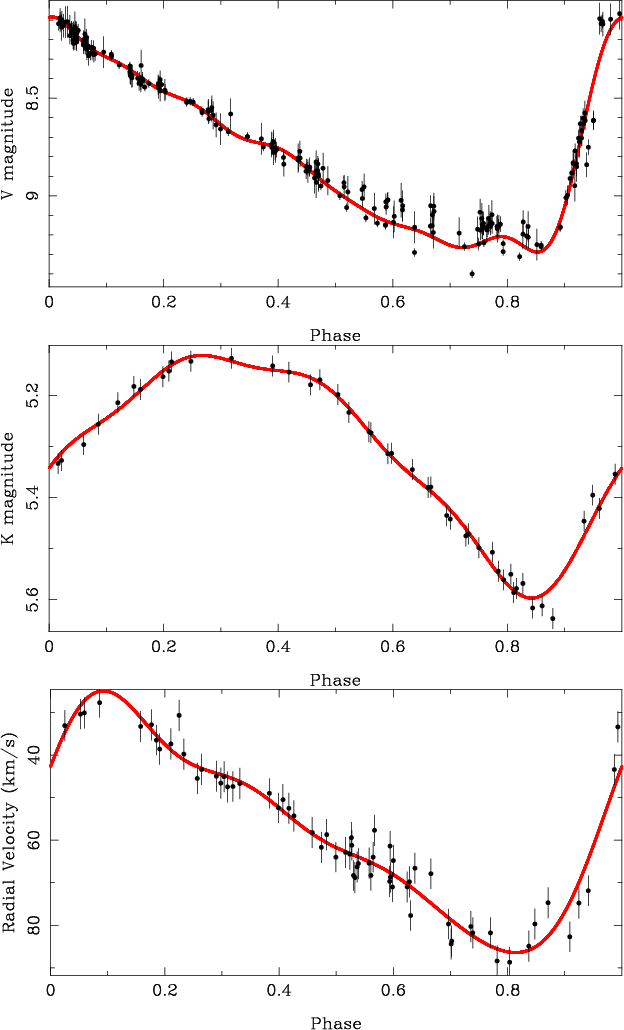
Figure 1: The phased curves in V, K and RV are shown for AQ Pup. Data points are shown with errors bars and the line shows the harmonic fit. The fits to all stars in the sample are available from the author upon request. |
| Open with DEXTER | |
In the text
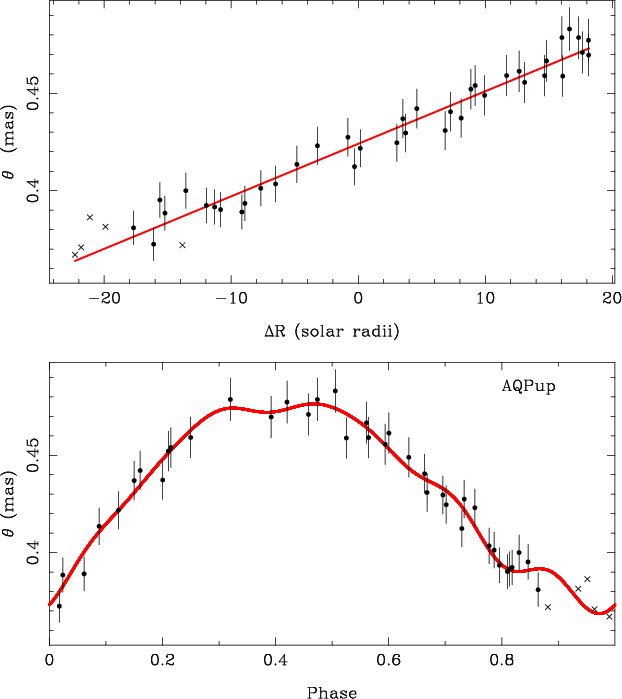 |
Figure 2: For AQ Pup, the top panel shows the linear-bisector fit to the angular diameter as a function of radial displacement. The bottom panel shows the angular diameter against phase. Crosses represent datapoints not considered in the fit. The fits to all stars in the sample are available from the author upon request. |
| Open with DEXTER | |
In the text
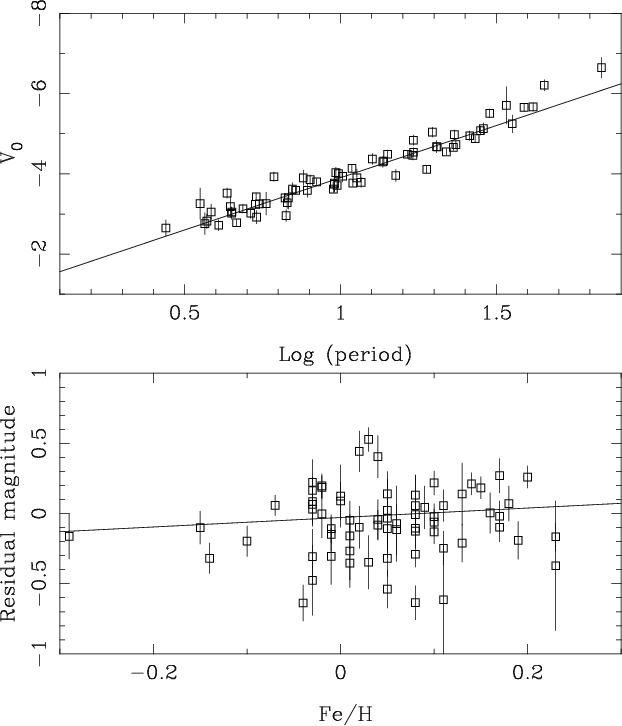 |
Figure 3: Period-Luminosity relation in the V-band. The bottom panel shows the residual plotted versus metallicity. Lines indicate the fits to the data. |
| Open with DEXTER | |
In the text
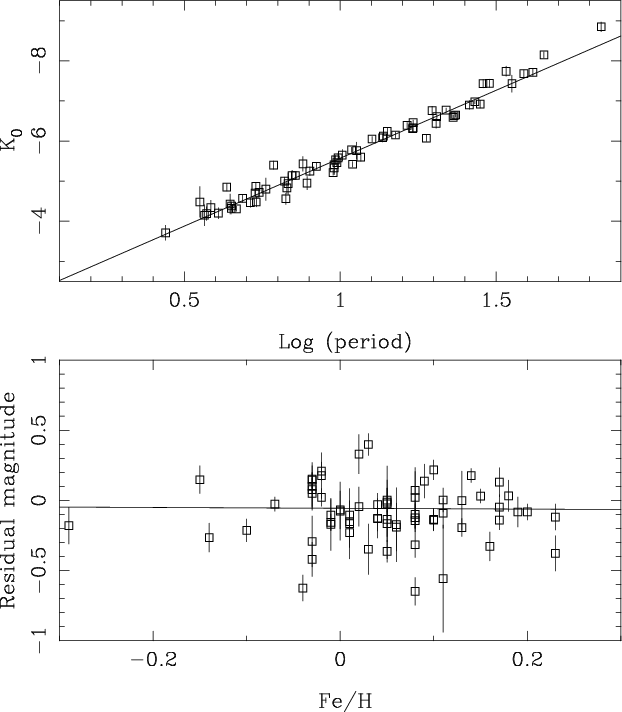 |
Figure 4: Period-Luminosity relation in the K-band. The bottom panel shows the residual plotted versus metallicity. Lines indicate the fits to the data. |
| Open with DEXTER | |
In the text