![\begin{figure}
\par\includegraphics[scale=0.80]{0157f1.eps}
\end{figure}](/articles/aa/full/2008/32/aa10157-08/Timg51.gif) |
Figure 1:
Schematic view of the WFI dither pattern. The
full lines denote the edges of the
|
| Open with DEXTER | |
In the text
![\begin{figure}
\par\includegraphics[width=12cm,clip]{0157f2.eps}
\end{figure}](/articles/aa/full/2008/32/aa10157-08/Timg78.gif) |
Figure 2:
Flat-fielded sky-subtracted and combined slitless
spectroscopic WFI field in the vicinity of HE 0940-1050. The spectra were
taken with the B filter and without rotation (i.e. north is up and east is
left on the image). The dispersion runs horizontally from left to right. The
three dithered 600 s exposures were combined to fill the inter-chip gaps. The
(linear) intensity of each pixel is weighted by its effective exposure time.
The total dimension of the combined image is
|
| Open with DEXTER | |
In the text
| |
Figure 3:
Masking of unwanted spectral orders.
The upper panel shows a
|
| Open with DEXTER | |
In the text
 |
Figure 4:
Sensitivity curves of the WFI B and
V filters derived from the spectrophotometric standard HD 49798. At
|
| Open with DEXTER | |
In the text
 |
Figure 5:
Differential source density of the survey
fields in
|
| Open with DEXTER | |
In the text
![\begin{figure}
\par\resizebox{8.8cm}{!}{\includegraphics[angle=270]{0157f6.eps}}
\end{figure}](/articles/aa/full/2008/32/aa10157-08/Timg98.gif) |
Figure 6: Integrated WFI V magnitude vs. median S/N in the WFI spectra in the field of HE 0940-1050 (dots). The line shows the fitted log-linear relation of the magnitude and the S/N for this field. |
| Open with DEXTER | |
In the text
 |
Figure 7: Visibility of strong emission lines over the covered wavelength range. Dashed lines mark gaps without major emission lines where quasar candidates are missed. |
| Open with DEXTER | |
In the text
 |
Figure 8:
Slitless spectra (black) and corresponding |
| Open with DEXTER | |
In the text
![\begin{figure}
\includegraphics[width=18cm]{0157f9.eps}
\end{figure}](/articles/aa/full/2008/32/aa10157-08/Timg114.gif) |
Figure 9:
Slitless WFI spectra of two newly discovered
quasars near HE 0940-1050. The upper left panel shows a close-up of the
combined slitless B-filtered exposures in the field of HE 0940-1050
taken without rotation (Fig. 2). The dispersion runs
horizontally from left to right. The lower left panel shows a direct WFI
B band image of the corresponding sky region north-east of HE 0940-1050
(
|
| Open with DEXTER | |
In the text
 |
Figure 10:
Blue magnitudes of the quasar candidates
observed with the VLT. The abscissa shows the photometric B magnitudes
obtained from the aquisition images, the ordinate the difference to
the magnitudes integrated from the slit spectra. Full (open) circles
correspond to measurements with (without) correction for slit losses.
The line marks a perfect 1:1 relation between
|
| Open with DEXTER | |
In the text
 |
Figure 11:
Comparison of the redshifts obtained with FORS2
and WFI. Circles (+ signs) denote quasar candidates with almost secure
(uncertain) WFI redshifts. Previously known quasars in the fields have been
added with their published redshift in comparison to the redshift measured in
the slitless spectra ( |
| Open with DEXTER | |
In the text
![\begin{figure}
\par\includegraphics[width=18cm]{0157f12.eps}
\end{figure}](/articles/aa/full/2008/32/aa10157-08/Timg126.gif) |
Figure 12:
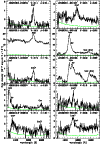
VLT/FORS2 spectra of the 11 discovered
quasars in the vicinity of HE 0940-1050. The spectra are shown in black
together with their |
| Open with DEXTER | |
In the text
 |
Figure 13:
Slitless spectra (black) and corresponding
|
| Open with DEXTER | |
In the text
![\begin{figure}
\par\includegraphics[angle=270,scale=1.04]{0157f14.eps}
\end{figure}](/articles/aa/full/2008/32/aa10157-08/Timg132.gif) |
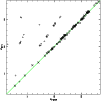
Figure 14: Redshift histograms of confirmed previously unknown quasars (cross-hashed), rediscovered quasars (hashed) and remaining quasar candidates (open). |
| Open with DEXTER | |
In the text
![\begin{figure}
\par\includegraphics[width=18.0cm]{0157f15.eps}
\end{figure}](/articles/aa/full/2008/32/aa10157-08/Timg135.gif) |
Figure 15:
Distributions of quasars in three of the survey
fields (upper panels: HE 0940-1050, middle panels:
Q 2139-4434, lower panels: HE 2243-6031).
Left panels: angular separation distribution of quasars and quasar
candidates with respect to the central quasar as a function of redshift.
Asterisks and star symbols mark known quasars and newly discovered confirmed
quasars, respectively. Crosses show remaining WFI quasar candidates. Symbol size
indicates apparent optical magnitude.
Right panels: quasar distribution on the sky centred on the targeted
known quasar in the field with indicated redshifts. Objects at |
| Open with DEXTER | |
In the text
![\begin{figure}
\par\resizebox{8.8cm}{!}{\includegraphics[angle=270]{0157f16.eps}}
\end{figure}](/articles/aa/full/2008/32/aa10157-08/Timg155.gif) |
Figure 16:
Survey selection function as a function of
redshift and apparent V magnitude. Contours correspond to median simulated
detection probabilities
|
| Open with DEXTER | |
In the text
![\begin{figure}
\par\includegraphics[width=18.0cm]{0157af1a.eps}
\end{figure}](/articles/aa/full/2008/32/aa10157-08/Timg328.gif) |
Figure A.1:
VLT/FORS2 spectra (black) and |
| Open with DEXTER | |
In the text
![\begin{figure}
\addtocounter{figure}{-1}
\includegraphics[width=18cm]{0157af1b.eps}
\end{figure}](/articles/aa/full/2008/32/aa10157-08/Timg329.gif) |
Figure A.1: continued. |
| Open with DEXTER | |
In the text
![\begin{figure}
\addtocounter{figure}{-1}
\includegraphics[width=18cm]{0157af1c.eps}
\end{figure}](/articles/aa/full/2008/32/aa10157-08/Timg330.gif) |
Figure A.1: continued. |
| Open with DEXTER | |
In the text
![\begin{figure}
\addtocounter{figure}{-1}
\includegraphics[width=18cm]{0157af1d.eps}
\end{figure}](/articles/aa/full/2008/32/aa10157-08/Timg331.gif) |
Figure A.1: continued. |
| Open with DEXTER | |
In the text
![\begin{figure}
\par\includegraphics[width=16cm]{0157bf1a.eps}
\end{figure}](/articles/aa/full/2008/32/aa10157-08/Timg333.gif) |
Figure B.1:
RA-ordered list of slitless WFI spectra of
88 unknown quasar candidates without follow-up spectra. The spectra are shown in
black together with their |
| Open with DEXTER | |
In the text
![\begin{figure}
\addtocounter{figure}{-1}
\includegraphics[width=16cm]{0157bf1b.eps}
\end{figure}](/articles/aa/full/2008/32/aa10157-08/Timg334.gif) |
Figure B.1: continued. Note that the field of PKS 0528-250 with 7 bona fide quasar candidates was not included in the follow-up campaign with FORS2. |
| Open with DEXTER | |
In the text
![\begin{figure}
\addtocounter{figure}{-1}
\includegraphics[width=16cm]{0157bf1c.eps}
\end{figure}](/articles/aa/full/2008/32/aa10157-08/Timg335.gif) |
Figure B.1: continued. |
| Open with DEXTER | |
In the text
![\begin{figure}
\addtocounter{figure}{-1}
\includegraphics[width=16cm]{0157bf1d.eps}
\end{figure}](/articles/aa/full/2008/32/aa10157-08/Timg336.gif) |
Figure B.1: continued. The spectrum of J214326.2-442036 might be contaminated by a nearby galaxy. Francis et al. (2004) list J214124.0-443301 as a quasar candidate with uncertain redshift, whereas they identified J214119.4-441256 as a galaxy at z=0.062 which is not supported by the slitless WFI spectrum. |
| Open with DEXTER | |
In the text
![\begin{figure}
\addtocounter{figure}{-1}
\includegraphics[width=15cm]{0157bf1e.eps}
\end{figure}](/articles/aa/full/2008/32/aa10157-08/Timg337.gif) |
Figure B.1: continued. |
| Open with DEXTER | |
In the text
![\begin{figure}
\par\includegraphics[angle=270,width=17.5cm]{0157cf1.eps}
\end{figure}](/articles/aa/full/2008/32/aa10157-08/Timg338.gif) |
Figure C.1: As Fig. 15 for the field centred near Q 0000-263. |
| Open with DEXTER | |
In the text
![\begin{figure}
\par\includegraphics[angle=270,width=17.5cm]{0157cf2.eps}
\end{figure}](/articles/aa/full/2008/32/aa10157-08/Timg339.gif) |
Figure C.2: As Fig. 15 for the field centred near Q 0002-422. |
| Open with DEXTER | |
In the text
![\begin{figure}
\par\includegraphics[angle=270,width=17.5cm]{0157cf3.eps}
\end{figure}](/articles/aa/full/2008/32/aa10157-08/Timg340.gif) |
Figure C.3: As Fig. 15 for the field centred near Q 0055-269. |
| Open with DEXTER | |
In the text
![\begin{figure}
\par\includegraphics[angle=270,width=18.0cm]{0157cf4.eps}
\end{figure}](/articles/aa/full/2008/32/aa10157-08/Timg341.gif) |
Figure C.4: As Fig. 15 for the field centred near Q 0302-003. |
| Open with DEXTER | |
In the text
![\begin{figure}
\par\includegraphics[angle=270,width=18.0cm]{0157cf5.eps}
\end{figure}](/articles/aa/full/2008/32/aa10157-08/Timg342.gif) |
Figure C.5: As Fig. 15 for the field centred near Q 0347-383. |
| Open with DEXTER | |
In the text
![\begin{figure}
\par\includegraphics[angle=270,width=18.0cm]{0157cf6.eps}
\end{figure}](/articles/aa/full/2008/32/aa10157-08/Timg343.gif) |
Figure C.6: As Fig. 15 for the field centred near CTQ 0247. |
| Open with DEXTER | |
In the text
![\begin{figure}
\par\includegraphics[angle=270,width=18.0cm]{0157cf7.eps}
\end{figure}](/articles/aa/full/2008/32/aa10157-08/Timg344.gif) |
Figure C.7: As Fig. 15 for the field centred near Q 0420-388. |
| Open with DEXTER | |
In the text
![\begin{figure}
\par\includegraphics[angle=270,width=18.0cm]{0157cf8.eps}
\end{figure}](/articles/aa/full/2008/32/aa10157-08/Timg345.gif) |
Figure C.8: As Fig. 15 for the field centred near PKS 0528-250. |
| Open with DEXTER | |
In the text
![\begin{figure}
\par\includegraphics[angle=270,width=18.0cm]{0157cf9.eps}
\end{figure}](/articles/aa/full/2008/32/aa10157-08/Timg346.gif) |
Figure C.9: As Fig. 15 for the field centred near CTQ 0460. |
| Open with DEXTER | |
In the text
![\begin{figure}
\par\includegraphics[angle=270,width=18.0cm]{0157cf10.eps}
\end{figure}](/articles/aa/full/2008/32/aa10157-08/Timg347.gif) |
Figure C.10: As Fig. 15 for the field centred near BR 1117-1329. |
| Open with DEXTER | |
In the text
![\begin{figure}
\par\includegraphics[angle=270,width=18.0cm]{0157cf11.eps}
\end{figure}](/articles/aa/full/2008/32/aa10157-08/Timg348.gif) |
Figure C.11: As Fig. 15 for the field centred near BR 1202-0725. |
| Open with DEXTER | |
In the text
![\begin{figure}
\par\includegraphics[angle=270,width=18.0cm]{0157cf12.eps}
\end{figure}](/articles/aa/full/2008/32/aa10157-08/Timg349.gif) |
Figure C.12: As Fig. 15 for the field centred near Q 1209+093. |
| Open with DEXTER | |
In the text
![\begin{figure}
\par\includegraphics[angle=270,width=18.0cm]{0157cf13.eps}
\end{figure}](/articles/aa/full/2008/32/aa10157-08/Timg350.gif) |
Figure C.13: As Fig. 15 for the field centred near Q 1451+123. |
| Open with DEXTER | |
In the text
![\begin{figure}
\par\includegraphics[angle=270,width=18.0cm]{0157cf14.eps}
\end{figure}](/articles/aa/full/2008/32/aa10157-08/Timg351.gif) |
Figure C.14: As Fig. 15 for the field centred near PKS 2126-158. |
| Open with DEXTER | |
In the text
![\begin{figure}
\par\includegraphics[angle=270,width=18.0cm]{0157cf15.eps}
\end{figure}](/articles/aa/full/2008/32/aa10157-08/Timg352.gif) |
Figure C.15: As Fig. 15 for the field centred near HE 2347-4342. |
| Open with DEXTER | |
In the text