 |
Figure 1:
The V-band Suprime-Cam image of Ursa Major I dSph covering a field of 34 |
| Open with DEXTER | |
In the text
![\begin{figure}
\par\resizebox{8.8cm}{!}{\includegraphics[angle=-90]{8232f2.eps}}
\end{figure}](/articles/aa/full/2008/31/aa8232-07/Timg31.gif) |
Figure 2:
Completeness of I (solid line) and V (doted line) photometry. The horizontal dotted line represents the 90 |
| Open with DEXTER | |
In the text
 |
Figure 3: Colour-magnitude diagrams of the UMa I dSph. Error bars show the photometric error at each magnitude level based on the artificial star test. The boundaries marked in the top-left panel are used to select stars belonging to the main sequence, giant branch and horizontal branch and blue strugglers of the UMa I dSph. |
| Open with DEXTER | |
In the text
 |
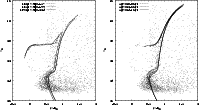
Figure 4:
Left: V-band colour-magnitude diagram of the UMa I dSph with the fiducial sequence of Galactic globular clusters (M 3, M 5, M 92).
Right: the theoretical isochrones overlaid in the V-band colour-magnitude diagram of the UMa I dSph. The lines stand for the interpolated Padova isochrones for
|
| Open with DEXTER | |
In the text
 |
Figure 5:
Upper: the spatial distribution of the stars selected by the dashed lines in Fig. 3, which cover the central 730 pc |
| Open with DEXTER | |
In the text
![\begin{figure}
\par\resizebox{8.8cm}{!}{\includegraphics[angle=-90]{8232f6.eps}}
\end{figure}](/articles/aa/full/2008/31/aa8232-07/Timg55.gif) |
Figure 6:
Radial profile derived by calculating the average number density within elliptical annuli. The effect of foreground stars is corrected by using a Galactic model (Girardi et al. 2005). The best-fitting exponential profile with the effective radius
|
| Open with DEXTER | |
In the text