 |
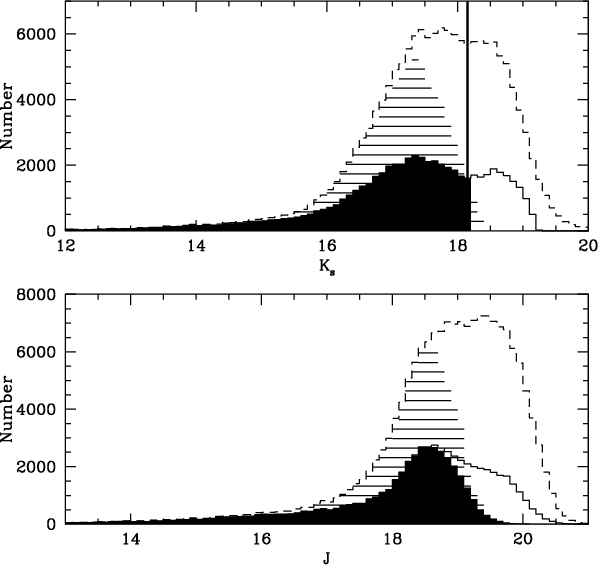
Figure 1:
Distribution of all sources listed in the catalogue as a
function of magnitude ( dashed-line histogram), those with a
photometric accuracy better than 10% ( dashed-filled
histogram) and of selected stellar as well as probably stellar
objects ( continuous histogram). |
| Open with DEXTER | |
In the text
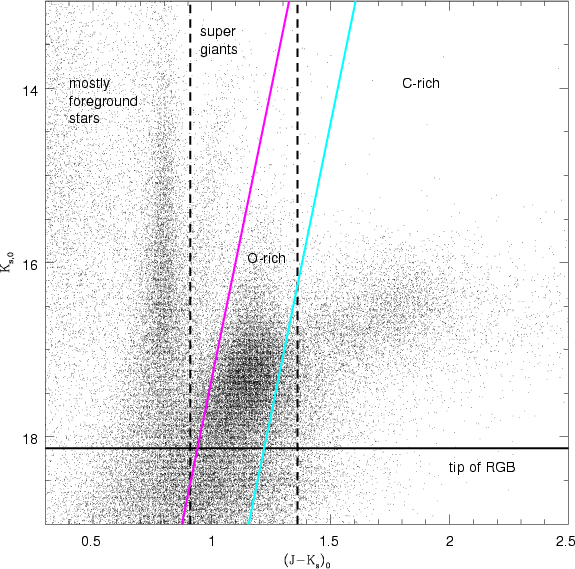 |
Figure 2:
Colour-magnitude diagram of the stellar sources detected
in J and |
| Open with DEXTER | |
In the text
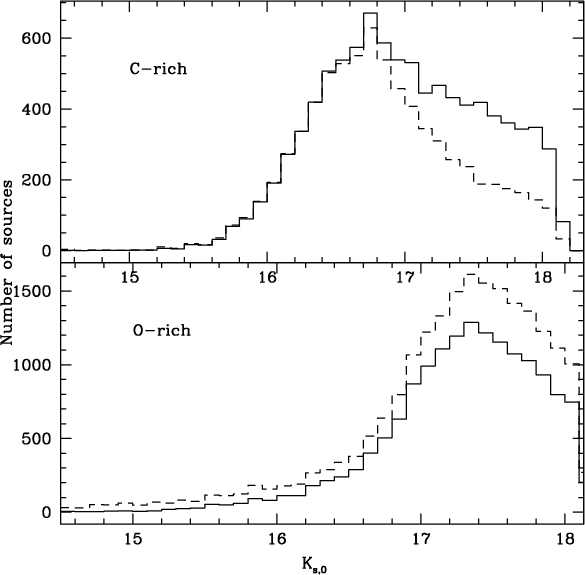 |
Figure 3:
Distribution of the number of C-rich and O-rich AGB stars
versus
|
| Open with DEXTER | |
In the text
| |
Figure 4: (From left to right) Distribution of the number density of C stars, M stars, super giant stars and mostly foreground stars. See the text for the selection of each sample. Contours are at: 3, 9, 18, 33, 45, 55, 65 and 75 for C stars, 2, 5, 10, 15, 20, 25, 30 and 35 for M stars, 0.5, 2, 4, 6, 8 and 10 for super giant stars, and 1.4, 2 and 3 for foreground stars. Darker regions correspond to higher numbers. North is to the top and East is to the left. |
| Open with DEXTER | |
In the text
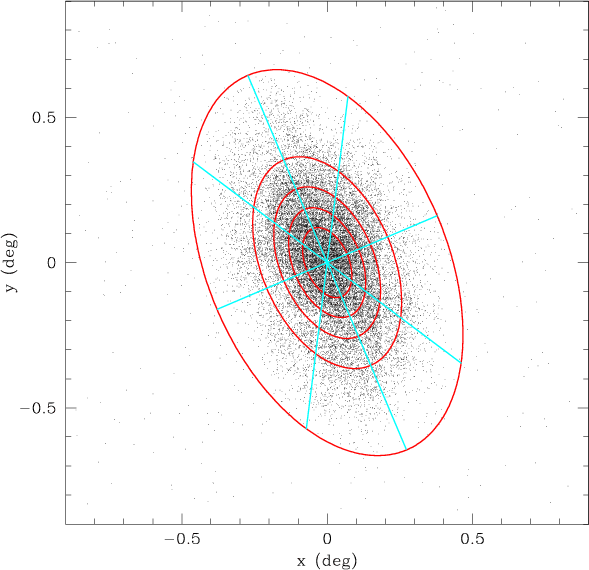 |
Figure 5:
Distribution of C-rich AGB stars across M 33. Coordinates are
in degrees and are centred at
|
| Open with DEXTER | |
In the text
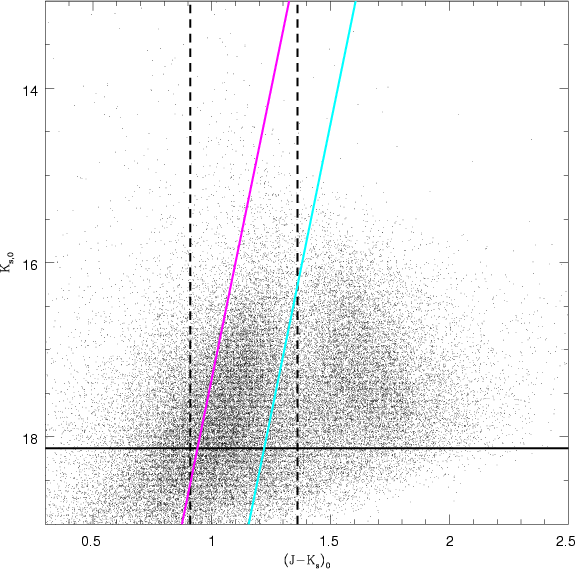 |
Figure 6:
Colour-magnitude diagram of the non-stellar sources detected
in J and |
| Open with DEXTER | |
In the text
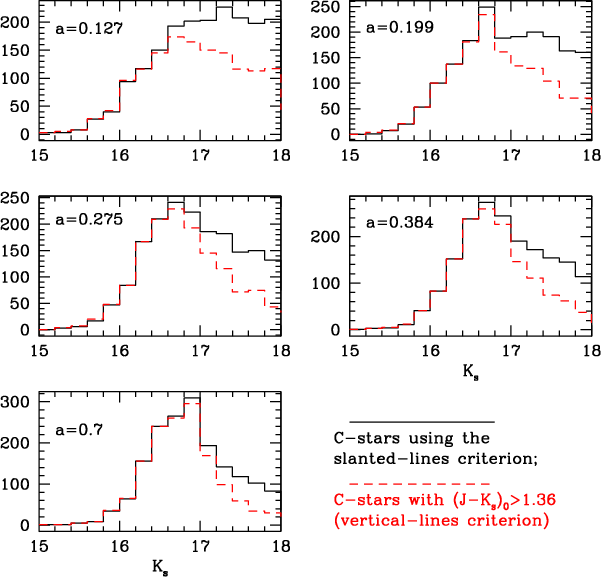 |
Figure 7: Distribution of the number of C-rich AGB stars within each elliptical ring. Rings are marked with the value of the semi-major axis (degrees). The selection of sources performed using slanted lines is shown by continuous-line histograms while the selection using vertical lines is shown by dashed-line histograms. Bins are of 0.2 mag. |
| Open with DEXTER | |
In the text
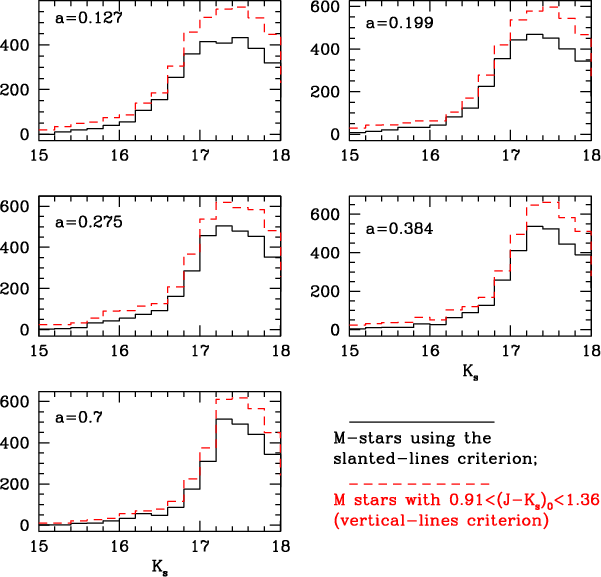 |
Figure 8: The same as for Fig. 7 but for O-rich AGB stars. |
| Open with DEXTER | |
In the text
| |
Figure 9:
Distribution of the difference between the peak of magnitudes
(squares) and colours (triangles) of C stars within 8 sectors and
their average of a unique ellipse with a semi-major axis
of
|
| Open with DEXTER | |
In the text
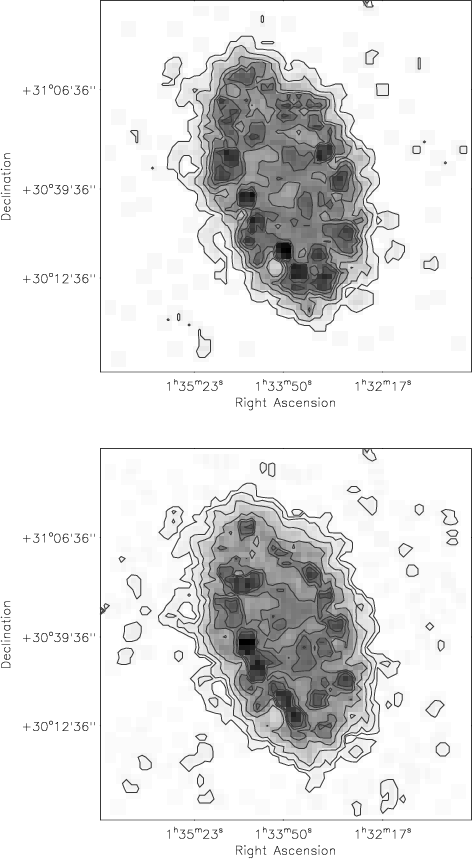 |
Figure 10: Distribution of the C/M ratio across M33. C-rich and O-rich AGB stars above the tip of the RGB have been selected using slanted lines ( top) or using vertical lines ( bottom). Darker regions correspond to higher ratios. Contours are at: 0.2, 0.6, 1.2, 1.6, 2.0 and 2.4 in the top panel and at 0.25, 0.5, 1.0, 2.0, 3.0, 3.5 and 4.0 in the bottom panel. |
| Open with DEXTER | |
In the text
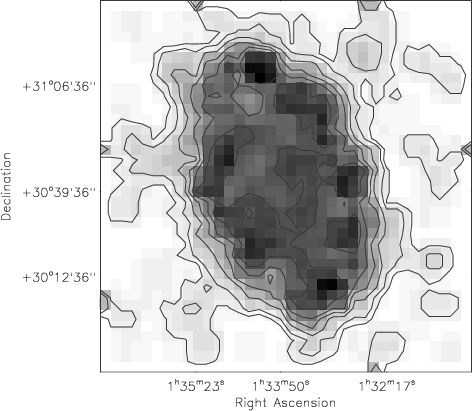 |
Figure 11:
The same as the bottom panel of Fig. 10 but
using bins of
|
| Open with DEXTER | |
In the text
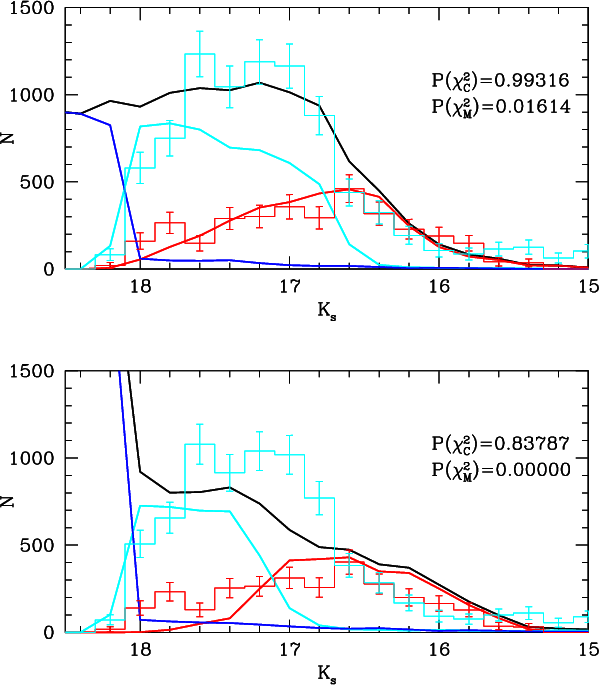 |
Figure 12:
Comparison between the observed |
| Open with DEXTER | |
In the text
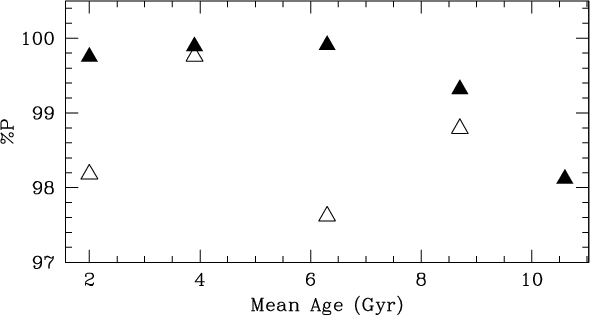 |
Figure 13: Probability as a function of mean age for models of a given metallicity which represent the stellar population of M 33 in a sector of a ring. Different symbols refer to a different metallicity as follows: Z=0.0005 (filled triangles), Z=0.001 (empty triangles). Other models explored in this study give a probability much lower than the values plotted here and are not shown. |
| Open with DEXTER | |
In the text
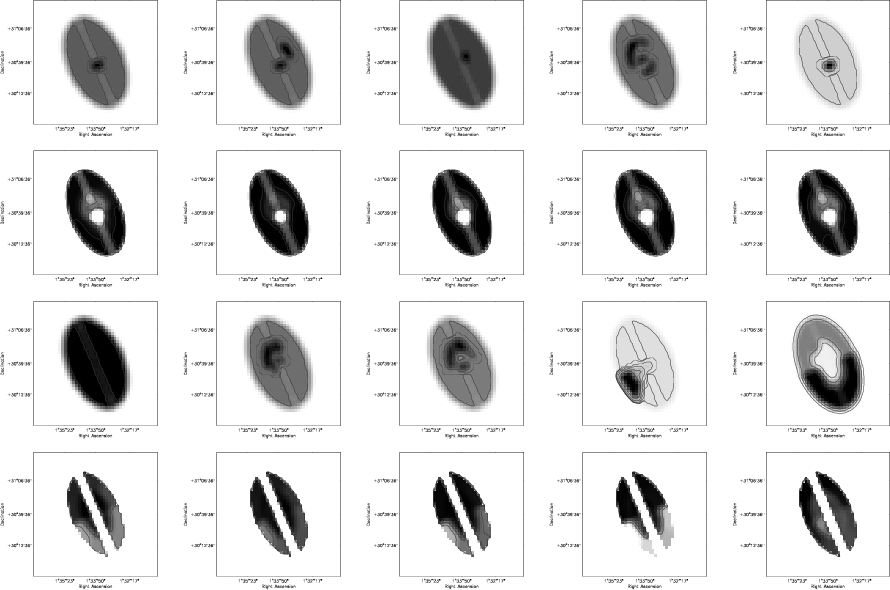 |
Figure 14:
Surface distribution of the most probable metallicity (
first and third rows) at a given SFR (or mean age) and the
associated probability distribution ( second and fourth rows)
obtained by fitting the |
| Open with DEXTER | |
In the text
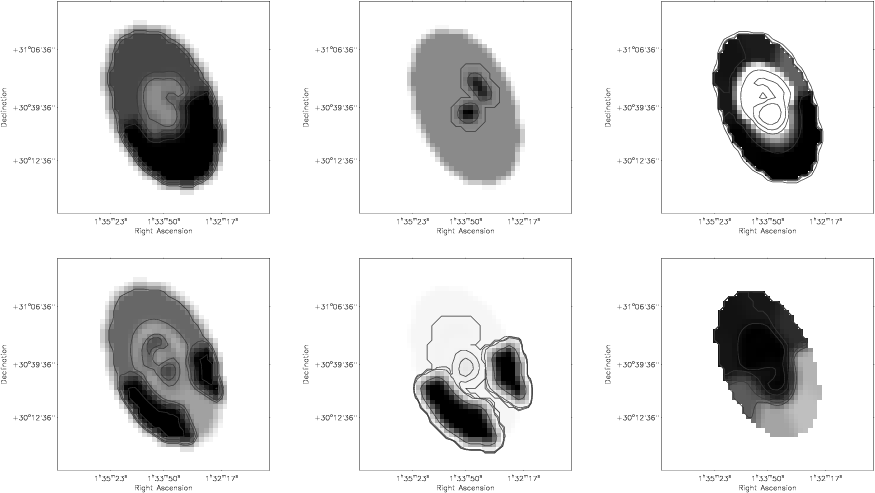 |
Figure 15:
Spatial distributions of the mean age of the stellar
population of M 33 ( left), of the metallicity ( middle) and of the
statistical probability that expresses the confidence level of the
previous distribution. These distributions have been constructed from
the comparison between the observed |
| Open with DEXTER | |
In the text
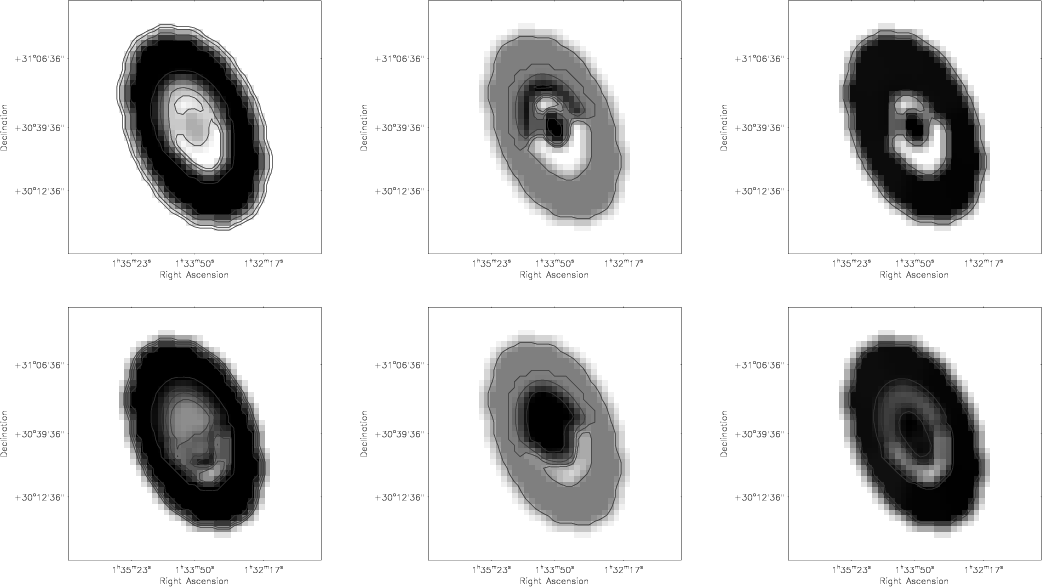 |
Figure 16:
Spatial distributions of the mean age of the stellar
population of M 33 ( left), of the metallicity ( middle) and of the
statistical probability that expresses the confidence level of the
previous distributions ( right). These maps have been constructed from
the comparison between the observed |
| Open with DEXTER | |
In the text
| |
Figure 17: Distribution of the difference between the individual distance moduli derived by Kim et al. (2002; filled circles) and other authors (see text; empty circles) and their mean versus position angle. Note that the point corresponding to McConnachie (2005) measurement is outside the range shown of this figure. The continuous sinusoid is the same as in Fig. 9 while the dashed sinusoid is the best fit to Kim et al. (2002) data only; the zero line is also indicated ( dotted). Error bars correspond to the random error for Kim et al. (2002) measurements, sytematic errors amount to +0.15 and-0.11, and the global error quoted by the authors for the other points. |
| Open with DEXTER | |
In the text
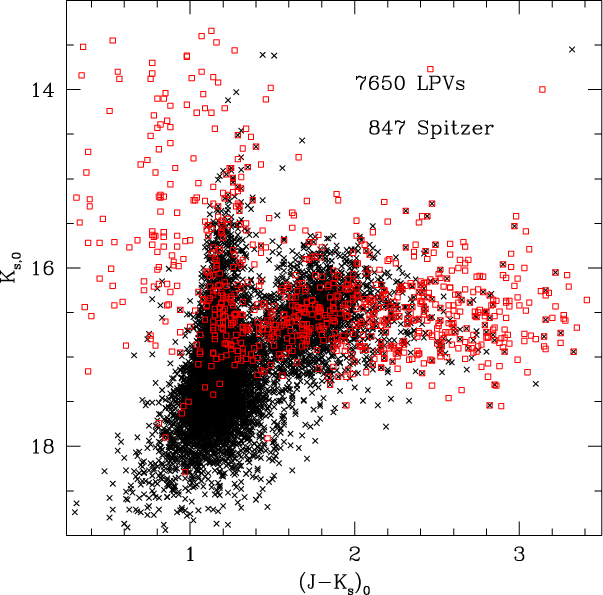 |
Figure 18: Colour-magnitude diagram of the near-infrared sources matched with the LPVs (crosses) from Hartman et al. (2006) and the variable stars detected by Spitzer (squares) from McQuinn et al. (2007). A colour version of this figure is available in the electronic version of the paper. |
| Open with DEXTER | |
In the text