![\begin{figure}
\par\includegraphics[width=8.8cm,clip]{9250f1.eps}\end{figure}](/articles/aa/full/2008/30/aa9250-07/Timg14.gif) |
Figure 1: Color image of the UDF 6462 clump-cluster from optical multi-band ACS imaging. The bent-chain UDF 6911 is visible to the left. |
| Open with DEXTER | |
In the text
![\begin{figure}
\par\includegraphics[width=16cm,clip]{9250f2.eps}\end{figure}](/articles/aa/full/2008/30/aa9250-07/Timg16.gif) |
Figure 2: The UDF 6462 clump-cluster: a) HST-ACS V-band image plotted in log-scale. UDF 6911 and 6886 are at very different redshifts (see text) and not interacting with UDF 6462. Dashed arrows indicate the pseudo-slits used to derive position-velocity diagrams. b) NICMOS H-band image plotted in log-scale, showing a more concentrated emission around the central bulge-like blob. c) H-band continuum from our SINFONI observations plotted in log-scale: UDF 6462 is detected, including its faint southern extensions; UDF 6911 is also detected. |
| Open with DEXTER | |
In the text
![\begin{figure}
\par\includegraphics[width=8.8cm,clip]{9250f3.eps}\end{figure}](/articles/aa/full/2008/30/aa9250-07/Timg31.gif) |
Figure 3: B-i color map of UDF 6462 from HST/ACS data, showing a color gradient from the central proto-bulge to the outer clumpy regions. |
| Open with DEXTER | |
In the text
![\begin{figure}
\par\includegraphics[width=8.3cm,clip]{9250f4.eps}\end{figure}](/articles/aa/full/2008/30/aa9250-07/Timg34.gif) |
Figure 4:
Integrated spectrum of UDF 6462 central regions ( top). Sky lines are shown below. Shaded bands corresponds to wavelength ranges where the sky emission level exceeds the average 1- |
| Open with DEXTER | |
In the text
![\begin{figure}
\par\includegraphics[width=12cm,clip]{9250f5.eps}\end{figure}](/articles/aa/full/2008/30/aa9250-07/Timg37.gif) |
Figure 5:
Moment maps for the H |
| Open with DEXTER | |
In the text
| |
Figure 6: Left: position-velocity diagram of UDF 6462 along its photometric major axis. The thick pseudo-slit used to compute this diagram is shown in Fig. 2. Data were resampled to a twice smaller pixel size on this P-V diagram. We note the global velocity gradient corresponding to the velocity field in Fig. 5; the steepest parts of the gradient around the emission peak correspond to the peak in the line-of-sight velocity dispersions. Right: position-velocity diagram for the model in Sect. 3, along its projected major axis, at full resolution and degraded to the spatial seeing, pixel size and instrumental velocity resolution. A global velocity gradient, similar to that found in UDF 6462, is reproduced together with large local disturbances and high velocity dispersions. Each clump in this modeled clump-cluster has an internal velocity gradient associated with its own spin, which could not be resolved at the SINFONI observations resolution. |
| Open with DEXTER | |
In the text
![\begin{figure}
\par\includegraphics[width=12cm,clip]{9250f7.eps}\end{figure}](/articles/aa/full/2008/30/aa9250-07/Timg40.gif) |
Figure 7: a), b) [NII] and [SII] intensity maps of UDF 6462. Metals appear to be centrally-concentrated around the reddish proto-bulge and UDF 6462 shows sign of central enrichment illustrated by the metallicity map c) where the O/H ratio is estimated from the [NII]/HII flux ratio (see text). |
| Open with DEXTER | |
In the text
| |
Figure 8: Snapshots of the disk mass density in the model, with time indicated in Myr. The halo mass center is marked by the black + symbol. The initial conditions are closely similar to the first snapshot, with a uniform disk density. The last snapshot shown here is slightly before the projection reproducing the UDF 6462 morphology (Fig. 9). We note that the asymmetrical aspect produced by the initial disk-halo offset is amplified by a long spiral arm extension and the outer location of one of the clumps. |
| Open with DEXTER | |
In the text
 |
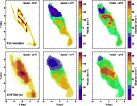
Figure 9: Projection of the model reproducing the UDF 6462 clump-cluster morphology, after 380 Myrs of evolution. a) Projected density map of stars formed less than 300 Myrs ago to mimic the V-band map shown in Fig. 2. b) Line-of-sight velocity map. The velocity field was smoothed to a 1 kpc resolution (Gaussian smoothing) to reduce the numerical noise, and a cut-off along an isodensity contour was applied. c) Line-of-sight velocity dispersion map. Under this projection, the model qualitatively reproduces the severely disturbed rotation pattern observed in UDF 6462, with a large-scale velocity gradient and a central peak in the velocity dispersion. d)-f) Similar predictions of moment maps degraded to the spatial resolution of our SINFONI observations. Irregularities in the velocity field are still visible, for instance the high-velocity region around X=-2 and Y=-1 kpc, which is comparable to the velocity anomalies observed in UDF 6462. |
| Open with DEXTER | |
In the text
![\begin{figure}
\par\includegraphics[width=8.5cm,clip]{9250f10.eps}\end{figure}](/articles/aa/full/2008/30/aa9250-07/Timg68.gif) |
Figure 10: Position-velocity diagram of UDF 6911 along its apparent major axis, in the [OIII] emission line. The thick pseudo-slit used to compute this diagram is shown in Fig. 2. |
| Open with DEXTER | |
In the text
 |
Figure A.1:
Spectral energy distributions of the entire system (top line), central
bulge-like object (middle line), and several clumps ( bottom left). Symbols are the best model fits for the bulge and for one of the clumps. A good fit is obtained for the clumps without an old stellar population, while the bulge is inferred to have a |
| Open with DEXTER | |
In the text
![\begin{figure}
\par\includegraphics[width=8cm,clip]{9250f12.eps}\end{figure}](/articles/aa/full/2008/30/aa9250-07/Timg73.gif) |
Figure B.1:
Gas density and metallicity maps in several galaxy merger models with a clumpy gas distribution. Outer star-forming regions can have been previously enriched in the inner disks of the progenitor spirals, such as the tail to the bottom-left in case b), the clump to the left in case c), or the various external clumps in cases a) and d). These cases are typical of the merger models from the G ALMER database. Snapshots correspond to between 25 and 40 kpc in radius and are all in |
| Open with DEXTER | |
In the text
 |
Figure B.2:
Clump-cluster model formed by internal disk fragmentation. The gas density and metallicity maps are shown at two stages in the evolution. Green contours on the metal maps are metallicity contours, linearly spaced from 0 to 0.05. Each box is
|
| Open with DEXTER | |
In the text