| |
Figure 1:
Distribution of the |
| Open with DEXTER | |
In the text
| |
Figure 2:
Distribution of the |
| Open with DEXTER | |
In the text
| |
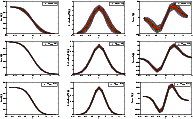
Figure 3:
From left to right, |
| Open with DEXTER | |
In the text
 |
Figure 4:
From left to right, and from top to bottom, the
area, contour length, and genus of the data (asterisk *) as a function
of threshold for the 143K03 maps with
|
| Open with DEXTER | |
In the text
 |
Figure 5:
From left to right, and from top to bottom, the
Gaussianity analysis of Archeops data maps at resolutions:
|
| Open with DEXTER | |
In the text
| |
Figure 6:
From left to right,
|
| Open with DEXTER | |
In the text
| |
Figure 7:
From left to right, the non-Gaussian part of a full sky
CMB simulation at low resolution (
|
| Open with DEXTER | |
In the text