 |
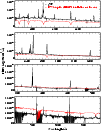
Figure 1:
Resulting de-reddened spectrum of HD 45166 decomposed into the qWR star (full black line) and the B7 V
companion (dashed red line). As anticipated in Paper I, the qWR star is dominant in the blue part of the spectrum, while the B7 V
companion dominates for
|
| Open with DEXTER | |
In the text
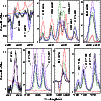 |
Figure 2:
Normalized spectrum of the qWR star in HD 45166 (black line) compared with spherical CMFGEN models with
|
| Open with DEXTER | |
In the text
 |
Figure 3:
a) Comparison between the continuum flux predicted by CMFGEN models for the qWR star in the range
|
| Open with DEXTER | |
In the text
 |
Figure 4: Velocity law (panel a)), density structure b), electron density c), and Rosseland optical depth d) of HD 45166 as a function of distance. |
| Open with DEXTER | |
In the text
 |
Figure 5: Ionization fractions of HD 45166 as a function of distance, derived from the spherical CMFGEN models of the most abundant ions in the wind of the qWR star. The ionization fractions are normalized by the total number of ions. |
| Open with DEXTER | |
In the text
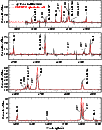 |
Figure 6: Comparison between the line profiles predicted by the best CMFGEN spherical model with the observations of HD 45166, in the spectral region 3850-5950 Å. The strongest spectral lines used in the analysis are identified. |
| Open with DEXTER | |
In the text
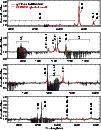 |
Figure 7: Same as Fig. 6, but for the spectral region of 6000-8800 Å. |
| Open with DEXTER | |
In the text
 |
Figure 8:
Line formation region for the strongest lines of HD 45166 used in the spectroscopic analysis. For
each panel the quantity |
| Open with DEXTER | |
In the text
| |
Figure 9: Density contrast of the HD 45166 models with latitude-dependent density distributions (normalized to the density distribution of the spherical model), as a function of latitude. Each model is labeled as in Table 5; model 9 has the same density distribution as model 4, and is not shown. The equator of the star is at [x,0], while the pole is located at [0,y]. The colorbar in the right has a linear color scale, which we adopted the same for all models, to highlight the different density variations as a function of latitude. The maximum value in the colorbar is 1.8, which corresponds to the maximum value found in model 5. |
| Open with DEXTER | |
In the text
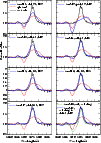 |
Figure 10:
Comparison between the line profiles computed with the 2D code of Busche & Hillier (2005) (blue line) with the
observations of HD 45166 around He I |
| Open with DEXTER | |
In the text
![\begin{figure}
\par\resizebox{8.8cm}{!}{\includegraphics[angle=0]{9511f11a.eps}}...
...}}\par\resizebox{8.8cm}{!}{\includegraphics[angle=0]{9511f11c.eps}}
\end{figure}](/articles/aa/full/2008/25/aa09511-08/Timg150.gif) |
Figure 11:
Average intensity spectrum and TVS of HD 45166 for
He II |
| Open with DEXTER | |
In the text
 |
Figure 12:
Upper panel: radial density profile of the C3+ and C4+ ions along the wind of HD 45166. Lower panel:
line formation region of C IV
|
| Open with DEXTER | |
In the text
 |
Figure A.1:
Intensity of the He II lines of the Pickering series as a function of the upper quantum number, normalized
such that I(He II |
| Open with DEXTER | |
In the text