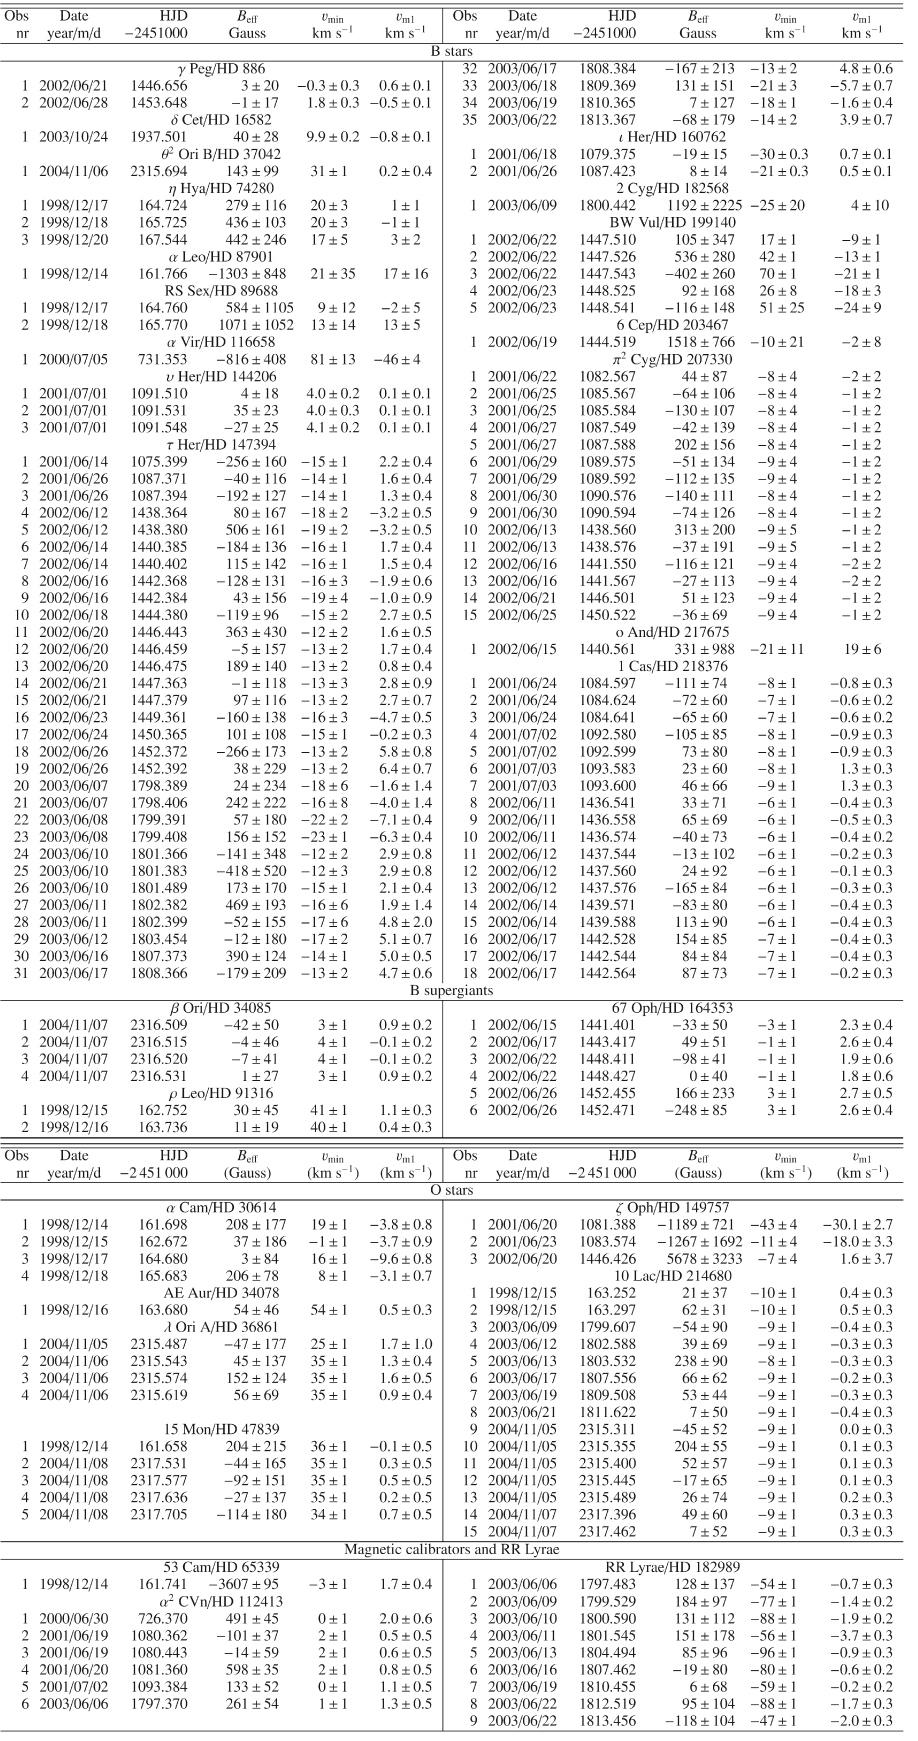
Table 3:
Summary of the results of the data analysis. The columns denote, respectively: sequence number of the observation, date of observation, Heliocentric Julian date, measured longitudinal component of magnetic field strength (integrated over the stellar disk) with 1 errors, velocity of the minimum, and first moment of the Stokes I line profile, both with 1
errors, for all observed targets arranged in the same order as in Table 2.
errors, velocity of the minimum, and first moment of the Stokes I line profile, both with 1
errors, for all observed targets arranged in the same order as in Table 2.
|
Source LaTeX |
All tables |
In the text