Deep optical CCD images of the supernova remnant G 15.1-1.6 were obtained where filamentary and diffuse emission was discovered. The images, taken in the emission lines of H
A&A 481, 705-712 (2008)
DOI: 10.1051/0004-6361:20079156
P. Boumis1 - J. Alikakos1,2 - P. E. Christopoulou2 - F. Mavromatakis3 - E. M. Xilouris1 - C. D. Goudis1,2
1 - Institute of Astronomy & Astrophysics, National
Observatory of Athens, I. Metaxa & V. Paulou, P. Penteli, 15236
Athens, Greece
2 - Astronomical Laboratory, Department of Physics, University of
Patras, 26500 Rio-Patras, Greece
3 - Technological Education Institute of Crete, General Department of
Applied Science, PO Box 1939, 710 04 Heraklion, Crete, Greece
Received 27 November 2007 / Accepted 17 January 2008
Abstract
Deep optical CCD images of the supernova remnant G
15.1-1.6 were obtained where filamentary and diffuse emission was
discovered. The images, taken in the emission lines of H![]() N II],
[S II], and [O III], reveal filamentary and diffuse structures all
around the remnant. The radio emission at 4850 MHz in the same area
is found to be strongly correlated with the brightest optical filaments.
The IRAS 60
N II],
[S II], and [O III], reveal filamentary and diffuse structures all
around the remnant. The radio emission at 4850 MHz in the same area
is found to be strongly correlated with the brightest optical filaments.
The IRAS 60 ![]() m emission may also be correlated with the optical
emission but to a lesser extent. The flux-calibrated images suggest
that the optical emission originates from shock-heated gas
([S II]/H
m emission may also be correlated with the optical
emission but to a lesser extent. The flux-calibrated images suggest
that the optical emission originates from shock-heated gas
([S II]/H![]() > 0.4), while there is a possible H II region
([S II]/H
> 0.4), while there is a possible H II region
([S II]/H![]()
![]() 0.3) contaminating the supernova remnant's
emission to the east. Furthermore, deep long-slit spectra were
taken at two bright filaments and also show that the emission
originates from shock-heated gas. An [O III] filamentary structure
is also detected farther to the west, but it lies outside the
remnant's boundaries and may not be associated to it. The
[O III] flux suggests shock velocities into the interstellar
``clouds''
0.3) contaminating the supernova remnant's
emission to the east. Furthermore, deep long-slit spectra were
taken at two bright filaments and also show that the emission
originates from shock-heated gas. An [O III] filamentary structure
is also detected farther to the west, but it lies outside the
remnant's boundaries and may not be associated to it. The
[O III] flux suggests shock velocities into the interstellar
``clouds'' ![]() 100 km s-1, while the [S II
100 km s-1, while the [S II
![]() ratio indicates
electron densities up to
ratio indicates
electron densities up to ![]() 250 cm-3. Finally, the H
250 cm-3. Finally, the H![]() emission is measured to be between 2 to
emission is measured to be between 2 to ![]() 10-16 erg s-1 cm-2 arcsec-2, while the
lower limit to the distance is estimated at 2.2 kpc.
10-16 erg s-1 cm-2 arcsec-2, while the
lower limit to the distance is estimated at 2.2 kpc.
Key words: ISM: general - ISM: supernova remnants - ISM: individual objects: G15.1-1.6
Supernova remants (SNRs) play an important role when studying the SN mechanism, the interstellar medium (ISM), and their interaction. Most of the SNRs have been detected in radio from their nonthermal synchrotron emission. Observations of SNRs in X-rays allow us to probe the hot gas inside the primary shock wave directly, while optical observations offer an important tool for studying of the interaction of the shock wave with dense material found in the ISM. New searches in the optical waveband continue to identify Galactic SNRs (e.g. Boumis et al. 2002, 2005; Mavromatakis et al. 2002, 2005), while in the past decade, observations in X-rays have also detected new Galactic SNRs (e.g. Seward et al. 1995; see also Green 2006, for a complete catalogue).
G 15.1-1.6 is not a well-known SNR. It was first detected by Reich
et al. (1988) in the Effelsberg 2.7 GHz survey, and the radio
image was published by Reich et al. (1990). It is classified
as a shell-type SNR with a spectral index of ![]() 0.8. Its angular
size is 30
0.8. Its angular
size is 30![]()
![]() 24
24![]() ,
and using the
brightness-to-diameter (
,
and using the
brightness-to-diameter (![]() -D) relationship, the distance of
the remnant was calculated at 5.7 kpc (Green 2006). Radio
surveys of the surrounding area do not reveal any pulsar associated
with G 15.1-1.6, while it is not detected optically in the past.
-D) relationship, the distance of
the remnant was calculated at 5.7 kpc (Green 2006). Radio
surveys of the surrounding area do not reveal any pulsar associated
with G 15.1-1.6, while it is not detected optically in the past.
In this paper we report the optical detection of G 15.1-1.6. We
present images of the remnant in the H![]() N II], [S II], and [O III] emission lines. Deep long-slit spectra were also acquired in a
number of selected areas. In Sect. 2 we present information about the
observations and data reduction, while the results of the imaging and
spectroscopic observations are given in Sect. 3. In Sect. 4 we discuss
the optical properties of this SNR, while we summarize the
results of this work in Sect. 5.
N II], [S II], and [O III] emission lines. Deep long-slit spectra were also acquired in a
number of selected areas. In Sect. 2 we present information about the
observations and data reduction, while the results of the imaging and
spectroscopic observations are given in Sect. 3. In Sect. 4 we discuss
the optical properties of this SNR, while we summarize the
results of this work in Sect. 5.
Table 1: Imaging and spectral log.
![\begin{figure}
\par\includegraphics[width=12cm,clip]{9156fig1.eps}
\end{figure}](/articles/aa/full/2008/15/aa9156-07/img24.gif) |
Figure 1:
The G 15.1-1.6 in the H |
| Open with DEXTER | |
G 15.1-1.6 was observed with the 0.3 m Schmidt-Cassegrain (f/3.2)
telescope at Skinakas Observatory, Crete, Greece in June 11 and August
27, 28, and 30, 2005. The data were taken with a
![]() Thomson CCD with a pixel size of 19
Thomson CCD with a pixel size of 19 ![]() m resulting in a
70
m resulting in a
70![]()
![]() 70
70![]() field of view and an image scale of 4
field of view and an image scale of 4
![]() per pixel. The area of the remnant was observed with the H
per pixel. The area of the remnant was observed with the H![]() N II], [S
II], and [O III] filters. The exposure time was set to 2400 s
for each observation and to 180 s for the continuum red and blue
filters. The continuum-subtracted images of the H
N II], [S
II], and [O III] filters. The exposure time was set to 2400 s
for each observation and to 180 s for the continuum red and blue
filters. The continuum-subtracted images of the H![]() N II] and [O
III] emission lines are shown in Figs. 1 and 2,
respectively.
N II] and [O
III] emission lines are shown in Figs. 1 and 2,
respectively.
![\begin{figure}
\par\includegraphics[width=12cm,clip]{9156fig2.eps}
\end{figure}](/articles/aa/full/2008/15/aa9156-07/img26.gif) |
Figure 2:
The G 15.1-1.6 in the [O III] filter. Shadings run linearly from 0 to
|
| Open with DEXTER | |
The IRAF and MIDAS packages were used for the data reduction. All frames were bias-subtracted and flatfield-corrected using a series of twilight flatfields. Using the continuum images multiplied with a proper factor, we subtracted the stars in order to present the remnant. The spectrophotometric standards stars HR5501, HR7596, HR7950, HR8634, and HR9087 (Hamuy et al. 1992) were used for the absolute flux calibration. The astrometric solution for all data frames were calculated using the Hubble Space Telescope (HST) Guide Star Catalogue (Lasker et al. 1999). All the equatorial coordinates quoted in this work refer to epoch 2000.
Optical images at higher angular resolution of G 15.1-1.6 were also
obtained with the 1.3 m (f/7.7) Ritchey-Cretien telescope at
Skinakas Observatory in July 4-7 and 8-10, 2007, using the
H![]() + [N II] and the [O III] interference filters,
respectively. The detector was a
+ [N II] and the [O III] interference filters,
respectively. The detector was a
![]() SITe CCD with a
field of view of
SITe CCD with a
field of view of
![]() arcmin2 and an image scale of
0.5
arcmin2 and an image scale of
0.5
![]() per pixel. Nine exposures were taken through the
H
per pixel. Nine exposures were taken through the
H![]() + [N II] and [O III] filters each of 2400 s and nine
corresponding exposures in the continuum, each of 180 s. During the
observations, the ``seeing'' varied between 0.8
+ [N II] and [O III] filters each of 2400 s and nine
corresponding exposures in the continuum, each of 180 s. During the
observations, the ``seeing'' varied between 0.8
![]() and 1.5
and 1.5
![]() ,
while the full width at half maximum (FWHM) of the star images was
between 1.2
,
while the full width at half maximum (FWHM) of the star images was
between 1.2
![]() and 2.1
and 2.1
![]() .
The continuum-subtracted mosaic of
the H
.
The continuum-subtracted mosaic of
the H![]() + [N II] and [O III] images are shown in
Figs. 3 and 4, respectively.
+ [N II] and [O III] images are shown in
Figs. 3 and 4, respectively.
![\begin{figure}
\par\includegraphics[width=15cm,clip]{9156fig3.eps}
\end{figure}](/articles/aa/full/2008/15/aa9156-07/img28.gif) |
Figure 3:
The continuum-subtracted mosaic of G 15.1-1.6 taken with
the 1.3-m telescope in the light of H |
| Open with DEXTER | |
![\begin{figure}
\par\includegraphics[width=12cm,clip]{9156fig4.eps}
\end{figure}](/articles/aa/full/2008/15/aa9156-07/img29.gif) |
Figure 4: The continuum-subtracted mosaic of G 15.1-1.6 taken with the 1.3-m telescope in the light of [O III]. The image has been smoothed to suppress the residuals from the imperfect continuum subtraction. |
| Open with DEXTER | |
![\begin{figure}
\par\includegraphics[width=11.5cm,clip]{9156fig5.eps}
\end{figure}](/articles/aa/full/2008/15/aa9156-07/img30.gif) |
Figure 5: Typical long-slit spectra. |
| Open with DEXTER | |
Starting from the north, a bright filament 2![]() long (named A in
Fig. 1) is present with its center approximately at
long (named A in
Fig. 1) is present with its center approximately at
![]()
![]() 24
24![]() 04
04![]() and
and
![]()
![]() 25
25![]() 47
47
![]() .
This filament lies a few arcminutes to
the northeast of the very bright 4
.
This filament lies a few arcminutes to
the northeast of the very bright 4![]() filamentary structure
(named B) which is between
filamentary structure
(named B) which is between
![]()
![]() 23
23![]() 49
49![]() ,
,
![]()
![]() 27
27![]() 26
26
![]() and
and
![]()
![]() 23
23![]() 36
36![]() ,
,
![]()
![]() 30
30![]() 55
55
![]() .
In particular, there is a
very bright filament 3
.
In particular, there is a
very bright filament 3![]() long and 1.2
long and 1.2![]() wide with
wide with
![]() 1
1![]() diffuse emission in its south. Southwest of this
filament a fainter one (C1) appears at
diffuse emission in its south. Southwest of this
filament a fainter one (C1) appears at
![]()
![]() 23
23![]() 34
34![]() ,
,
![]()
![]() 35
35![]() 08
08
![]() ,
which is up to 1
,
which is up to 1![]() long separated by a 2.5
long separated by a 2.5![]() gap with area B. This gap is due to a
dark region in the area (probably created by dust - supported also by
the IRAS map) preventing the detection of optical emission from the
SNR. Farther to the south, there is a prominent bright structure that
also appears strong and is designated as filament C2. This structure
(
gap with area B. This gap is due to a
dark region in the area (probably created by dust - supported also by
the IRAS map) preventing the detection of optical emission from the
SNR. Farther to the south, there is a prominent bright structure that
also appears strong and is designated as filament C2. This structure
(![]() 3
3![]() long,
long, ![]() 40
40
![]() wide) lies at
wide) lies at
![]()
![]() 23
23![]() 30
30![]() ,
,
![]()
![]() 41
41![]() 56
56
![]() .
To the
south, there is fainter 1
.
To the
south, there is fainter 1![]() long emission (named D), which has
strong [S II] emission like the filament in area A ([S II]/H
long emission (named D), which has
strong [S II] emission like the filament in area A ([S II]/H![]()
![]() 0.7). The east structure consists of two main parts; a very
bright one that covers an area of
0.7). The east structure consists of two main parts; a very
bright one that covers an area of ![]()
![]() arcmin2,
centered at
arcmin2,
centered at
![]()
![]() 24
24![]() 17
17![]() ,
,
![]()
![]() 39
39![]() 36
36
![]() (E1), and a more complex but less bright
one between
(E1), and a more complex but less bright
one between
![]()
![]() 24
24![]() 38
38![]() ,
,
![]()
![]() 31
31![]() 28
28
![]() ,
and
,
and
![]()
![]() 24
24![]() 20
20![]() ,
,
![]()
![]() 37
37![]() 51
51
![]() (E2). Diffuse emission is also
present close to the filamentary structures, as well as the center of
the SNR. All filamentary structures have the same curvature, which
supports their belonging to G 15.1-1.6. It is interesting to note
two very thin long filaments to the north of E2 extending for
(E2). Diffuse emission is also
present close to the filamentary structures, as well as the center of
the SNR. All filamentary structures have the same curvature, which
supports their belonging to G 15.1-1.6. It is interesting to note
two very thin long filaments to the north of E2 extending for
![]() 10
10![]() and joined to a 2.5
and joined to a 2.5![]() single filament. Similar
filaments also apear to the northeast of area A. Both seem to follow
the infrared emission but the low resolution of the latter does not
allow a detailed investigation.
single filament. Similar
filaments also apear to the northeast of area A. Both seem to follow
the infrared emission but the low resolution of the latter does not
allow a detailed investigation.
The detected [O III] emission (Figs. 2, 4) appears
less filamentary and more diffuse than in the H![]() N II] image. Typical
[O III] fluxes are listed in Table 2. Significant
differences between the H
N II] image. Typical
[O III] fluxes are listed in Table 2. Significant
differences between the H![]() N II] and [O III] images are present for many
of the filaments. In particular, to the north, west, and south (A, B,
C, and D), in contrast to the bright filaments found in H
N II] and [O III] images are present for many
of the filaments. In particular, to the north, west, and south (A, B,
C, and D), in contrast to the bright filaments found in H![]() N II], the
[O III] displays a different morphology with much fainter diffuse
emission. Only within area B, there is a bright [O III] filament
centered at
N II], the
[O III] displays a different morphology with much fainter diffuse
emission. Only within area B, there is a bright [O III] filament
centered at
![]()
![]() 23
23![]() 43
43![]() ,
,
![]()
![]() 28
28![]() 30
30
![]() ,
which lies exactly at the same position
with the bright one in H
,
which lies exactly at the same position
with the bright one in H![]() N II]. Farther to the west, there is a bright
[O III]filament (named F) splits to a very thin one
(
N II]. Farther to the west, there is a bright
[O III]filament (named F) splits to a very thin one
(![]() 30
30
![]() wide) at
wide) at
![]() 18
18![]() 23
23![]() 10
10![]() ,
,
![]()
![]() 31
31![]() 25
25
![]() and a wider complex structure at
and a wider complex structure at
![]()
![]() 22
22![]() 59
59![]() ,
,
![]()
![]() 35
35![]() 49
49
![]() .
This filament does not have an H
.
This filament does not have an H![]() N II] counterpart, and only very faint diffuse emission is found at the same
location. However, it is not correlated with the 4850 MHz radio map
(Fig. 6) of G 15.1-1.6 and probably does not belong to the
remnant. On the other hand, the bright H
N II] counterpart, and only very faint diffuse emission is found at the same
location. However, it is not correlated with the 4850 MHz radio map
(Fig. 6) of G 15.1-1.6 and probably does not belong to the
remnant. On the other hand, the bright H![]() N II] emission found to the
east (area E) also appears bright but less filamentary in [O III].
Finally, a similar situation appears both in [O III] and H
N II] emission found to the
east (area E) also appears bright but less filamentary in [O III].
Finally, a similar situation appears both in [O III] and H![]() N II] in the
areas where weak and diffuse emission is found.
N II] in the
areas where weak and diffuse emission is found.
All images being flux-calibrated provides a first indication of
the nature of the observed emission. An examination of the diagnostic
ratio [S II]/H![]() shows that the emission from the brightest parts of
the remnant originates from shock-heated gas, since we estimate
ratios [S II]/H
shows that the emission from the brightest parts of
the remnant originates from shock-heated gas, since we estimate
ratios [S II]/H![]() of 0.4-0.6, which agree with our spectral
measurements (Sect. 3.2). The northern and southern areas (A and D)
show [S II]/H
of 0.4-0.6, which agree with our spectral
measurements (Sect. 3.2). The northern and southern areas (A and D)
show [S II]/H![]()
![]() 0.7. A photoionization mechanism may be producing
the emission in the southeastern region since the ratio [S II]/H
0.7. A photoionization mechanism may be producing
the emission in the southeastern region since the ratio [S II]/H![]() is
is
![]() 0.3. The possibility that an H II emission contaminates the
remnant's emission to the east (E) cannot be ruled out since, for some
of the areas close to both the filament and to the central region of
the remnant, we estimate [S II]/H
0.3. The possibility that an H II emission contaminates the
remnant's emission to the east (E) cannot be ruled out since, for some
of the areas close to both the filament and to the central region of
the remnant, we estimate [S II]/H![]()
![]() 0.3-0.4 which also agrees
with our spectra.
0.3-0.4 which also agrees
with our spectra.
Assuming that all the bright filaments belong to the remnant, their
geometry allows us to define its diameter approximately. In
particular, the eastern border of the remnant is defined by the outer
filament at ![]()
![]() 18
18![]() 24
24![]() 40.0
40.0![]() ,
the western border at
,
the western border at ![]()
![]() 18
18![]() 23
23![]() 25.0
25.0![]() ,
the northern border at
,
the northern border at ![]()
![]() -16
-16![]() 24
24![]() ,
and the southern border at
,
and the southern border at ![]()
![]() -16
-16![]() 46
46![]() .
Then a diameter of 30
.
Then a diameter of 30![]()
![]() 24
24![]() can be derived with its center at
can be derived with its center at ![]()
![]() 18
18![]() 24
24![]() 00
00![]() ,
,
![]()
![]() -16
-16![]() 35
35![]() 20
20
![]() .
The optically derived angular
size is identical to what is quoted in Green's catalogue (Green
2006).
.
The optically derived angular
size is identical to what is quoted in Green's catalogue (Green
2006).
The absolute H![]() flux covers a range of values from 2 to
flux covers a range of values from 2 to
![]() 10-16 erg s-1 cm-2 arcsec-2. The [S II
10-16 erg s-1 cm-2 arcsec-2. The [S II
![]() ratio that was calculated between 1.3 and 1.4,
indicates electron densities between 40 and 150 cm-3 (Osterbrock
& Ferland 2006). However, taking the statistical errors on
the sulfur lines into account, we calculate that electron densities up
to 250 cm-3 are allowed (Shaw & Dufour
1995). Measurements for the [O III]/ H
ratio that was calculated between 1.3 and 1.4,
indicates electron densities between 40 and 150 cm-3 (Osterbrock
& Ferland 2006). However, taking the statistical errors on
the sulfur lines into account, we calculate that electron densities up
to 250 cm-3 are allowed (Shaw & Dufour
1995). Measurements for the [O III]/ H![]() ratio result in
values less than 6. Theoretical models of Cox & Raymond
(1985) and Hartigan et al. (1987) suggest that this
value is
ratio result in
values less than 6. Theoretical models of Cox & Raymond
(1985) and Hartigan et al. (1987) suggest that this
value is ![]() 6 for shocks with complete recombination zones, while
this limit is exceeded in case of shock with incomplete recombination
zones (Raymond et al. 1988). Our measured values suggest that
shocks with complete recombination zones are present. Therefore,
according to our measurements and the theoretical models above, the
estimated shock velocities are
6 for shocks with complete recombination zones, while
this limit is exceeded in case of shock with incomplete recombination
zones (Raymond et al. 1988). Our measured values suggest that
shocks with complete recombination zones are present. Therefore,
according to our measurements and the theoretical models above, the
estimated shock velocities are ![]() 100 km s-1.
100 km s-1.
The optical emission matches the radio emission of G 15.1-1.6 very
well at 4850 MHz, suggesting their correlation (Fig. 6). The
observed filaments are located close to the outer edge of the radio
contours but the low resolution of the radio images does not allow us
to determine the relative position of the filament with respect to the
shock front. To explore how the optical emission correlates with the
infrared emission, we examined IRAS images at 60 ![]() m of the same
area. Figure 6 shows a deep greyscale representation of the optical
emission (H
m of the same
area. Figure 6 shows a deep greyscale representation of the optical
emission (H![]() N II]) with overlapping contours of the infrared emission
(60
N II]) with overlapping contours of the infrared emission
(60 ![]() m). Although the low-resolution IRAS map does not permit a
detailed comparison with the optical image, there is a clear
enhancement of infrared emission in the area where the optical
emission of the SNR is detected. The infrared emission follows the
morphology of the SNR closely, but it also fills the central area that
shows no optical emission. We also examined the ROSAT All-sky survey
data, but no significant X-ray emission was detected.
m). Although the low-resolution IRAS map does not permit a
detailed comparison with the optical image, there is a clear
enhancement of infrared emission in the area where the optical
emission of the SNR is detected. The infrared emission follows the
morphology of the SNR closely, but it also fills the central area that
shows no optical emission. We also examined the ROSAT All-sky survey
data, but no significant X-ray emission was detected.
![\begin{figure}
\par\includegraphics[width=12cm,clip]{9156fig6.eps}
\end{figure}](/articles/aa/full/2008/15/aa9156-07/img39.gif) |
Figure 6:
The correlation between the H |
| Open with DEXTER | |
Table 2: Typically measured fluxes over the brightest filaments.
Table 3: Relative line fluxes.
An interstellar extinction c between (see Table 3) 1.17 (![]() 0.05) and 1.68
(
0.05) and 1.68
(![]() 0.05) or an
0.05) or an ![]() between 2.51
(
between 2.51
(![]() 0.11) and 3.60 (
0.11) and 3.60 (![]() 0.10) were measured, respectively. We
have also determined the electron density by measuring the density
sensitive line ratio of [S II
0.10) were measured, respectively. We
have also determined the electron density by measuring the density
sensitive line ratio of [S II
![]() .
The densities we measure are below
250 cm-3. Assuming that the temperature is close to 104 K, it is
possible to estimate basic SNR parameters. The remnant under
investigation is one of the least studied remnants and thus, the
current stage of its evolution is unknown. Assuming that the remnant
is still in the adiabatic phase of its evolution, the preshock cloud
density
.
The densities we measure are below
250 cm-3. Assuming that the temperature is close to 104 K, it is
possible to estimate basic SNR parameters. The remnant under
investigation is one of the least studied remnants and thus, the
current stage of its evolution is unknown. Assuming that the remnant
is still in the adiabatic phase of its evolution, the preshock cloud
density ![]() can be measured by using the relationship (Dopita
1979)
can be measured by using the relationship (Dopita
1979)
![\begin{displaymath}{n_{\rm [SII]} \simeq\ 45\ n_{\rm c} V_{\rm s}^2}~{\rm cm^{-3}},
\end{displaymath}](/articles/aa/full/2008/15/aa9156-07/img45.gif) |
(1) |
 |
(2) |
Estimated values of
![]() cm-2 and
cm-2 and
![]() cm-2 are given by Dickey &
Lockman (1990) and Kalberla et al. (2005)
respectively, for the column density in the direction of G 15.1-1.6. Using the relation of Ryter et al. (1975), we
obtain an
cm-2 are given by Dickey &
Lockman (1990) and Kalberla et al. (2005)
respectively, for the column density in the direction of G 15.1-1.6. Using the relation of Ryter et al. (1975), we
obtain an
![]() of
of
![]() and
and
![]() for the minimum and maximum c values
calculated from our spectra, respectively. Both values are consistent
with the estimated galactic
for the minimum and maximum c values
calculated from our spectra, respectively. Both values are consistent
with the estimated galactic ![]() considering the uncertainties
involved. Since, there are no other measurements of the interstellar
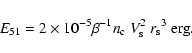
density n0, values of 0.1 and 1.0 will be examined. Following the
result of Eq. (2) and assuming the typical value of 1 for the
supernova explosion energy (E51), we find that the remnant may
lie at a distance greater than 2.2 kpc. Then, the lower interstellar
density of
considering the uncertainties
involved. Since, there are no other measurements of the interstellar
density n0, values of 0.1 and 1.0 will be examined. Following the
result of Eq. (2) and assuming the typical value of 1 for the
supernova explosion energy (E51), we find that the remnant may
lie at a distance greater than 2.2 kpc. Then, the lower interstellar
density of ![]() 0.1 cm-3 suggests that the column density is
greater than
0.1 cm-3 suggests that the column density is
greater than
![]() ,
while for
,
while for
![]() it becomes greater than
it becomes greater than
![]() .
Combining the previous results and assuming
that the column density is found in the range of
.
Combining the previous results and assuming
that the column density is found in the range of
![]() ,
then the lower interstellar density seems to
be more probable. However, since neither the distance nor the
interstellar medium density are accurately known, we cannot
confidently determine the current stage of evolution of G 15.1-1.6.
,
then the lower interstellar density seems to
be more probable. However, since neither the distance nor the
interstellar medium density are accurately known, we cannot
confidently determine the current stage of evolution of G 15.1-1.6.
Acknowledgements
J.A. acknowledges funding by the European Union and the Greek Ministry of Development in the framework of the program ``Promotion of Excellence in Research Institutes (2nd Part)''. Skinakas Observatory is a collaborative project of the University of Crete, the Foundation for Research and Technology-Hellas, and the Max-Planck-Institut für Extraterrestrische Physik.