 |
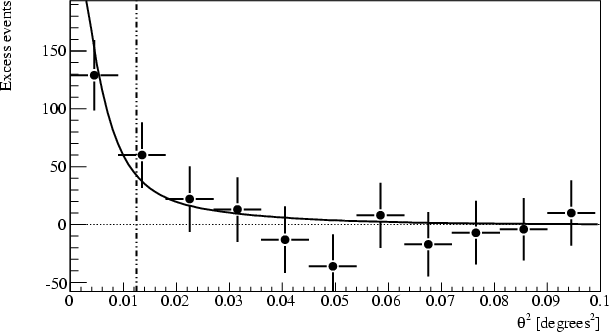
Figure 1: Angular distribution of excess events. The dot-dashed line shows the angular distance cut used for extracting the signal. The excess distribution is consistent with the HESS point spread function as derived from Monte Carlo simulations (solid line). |
| Open with DEXTER | |
In the text
![\begin{figure}
\par\includegraphics[width=8.8cm,clip]{9603fig2}
\end{figure}](/articles/aa/full/2008/15/aa09603-08/img19.gif) |
Figure 2:
Differential spectrum of RGB J0152+017. The spectrum obtained using spectrum cuts (black closed circles) is compared with the one obtained by the standard cuts (blue open circles). The black line shows the best fit by a powerlaw function of the former. The three points with the highest photon energy represent upper limits at 99% confidence level, calculated using Feldman & Cousins (1998). All error bars are only statistical. The fit parameters of a powerlaw fit are
|
| Open with DEXTER | |
In the text
| |
Figure 3:
Mean nightly integral flux from RGB J0152+017 above 300 GeV. Only the statistical errors are shown. Upper limits at 99% confidence level are calculated when no signal is found (grey points). The dashed line shows a fit of a constant to the data points with
|
| Open with DEXTER | |
In the text
![\begin{figure}
\par\includegraphics[origin=rb,angle=-90,width=12cm,clip]{9603fig4}
\end{figure}](/articles/aa/full/2008/15/aa09603-08/img43.gif) |
Figure 4: The spectral energy distribution of RGB J0152+017. Shown are the HESS spectrum ( red filled circles and upper limits), and contemporaneous RXTE ( blue open triangles), Swift/XRT (corrected for Galactic absorption, magenta filled circles), optical host galaxy-subtracted (ATOM) and radio (Nançay) observations ( large red filled squares). The black crosses are archival data. The blue open points in the optical R-band correspond to the total and the core fluxes from Nilsson et al. (2003). A blob-in-jet synchrotron self-Compton model (see text) applied to RGB J0152+017 is also shown, describing the soft X-ray and VHE parts of the SED, with a simple synchrotron model shown at low frequencies to describe the extended part of the jet. The contribution of the dominating host galaxy is shown in the optical band. The dashed line above the solid line at VHE shows the source spectrum after correcting for EBL absorption. The left- and right-hand side inlays detail portions of the observed X-ray and VHE spectrum, respectively. |
| Open with DEXTER | |
In the text