 |
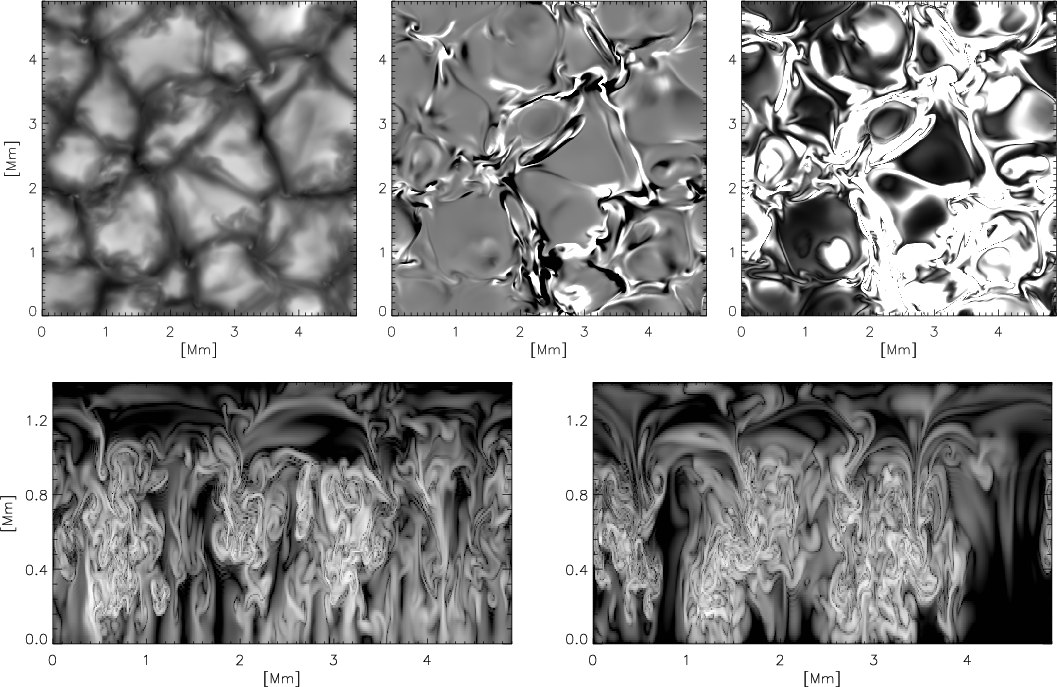
Figure 1:
Snapshot from the saturated phase of the dynamo run C
(Vögler & Schüssler 2007). The panels in the upper row show
the continuum intensity at 630 nm wavelength (upper left), a
gray-scale image (``magnetogram'', saturated at |
| Open with DEXTER | |
In the text
![\begin{figure}
\par\includegraphics[width=7.3cm,clip]{8998_fig2.eps}\end{figure}](/articles/aa/full/2008/13/aa8998-07/img24.gif) |
Figure 2:
Profiles of magnetic field strength averaged over surfaces of
constant
|
| Open with DEXTER | |
In the text
![\begin{figure}
\par\includegraphics[width=7cm,clip]{8998_fig3.eps}\end{figure}](/articles/aa/full/2008/13/aa8998-07/img34.gif) |
Figure 3:
Ratio of the root-mean-square of the horizontal field component
(solid line in Fig. 2) to the averaged unsigned
vertical field (dashed line in Fig. 2). In the optical
depth interval
|
| Open with DEXTER | |
In the text
![\begin{figure}
\par\includegraphics[width=7.5cm,clip]{8998_fig4.eps}\end{figure}](/articles/aa/full/2008/13/aa8998-07/img37.gif) |
Figure 4:
Magnetic energy spectra as a function of horizontal wave
number, k, for the height range roughly corresponding to
|
| Open with DEXTER | |
In the text