![\begin{figure}
\par\includegraphics[width=8.4cm,clip]{8327fig1.eps}
\end{figure}](/articles/aa/full/2008/11/aa8327-07/img47.gif) |
Figure 1: Combined image of the XMM-Newton observation of NGC 2808. The three centered circles shown represent the core, half-mass and tidal radii. The detected sources are plotted with their 90% error circles. We used a spatial binning factor of 80 and the image was smoothed with a Gaussian filter. For this reason the core appears blurry, a zoom is shown in Fig. 2. |
| Open with DEXTER | |
In the text
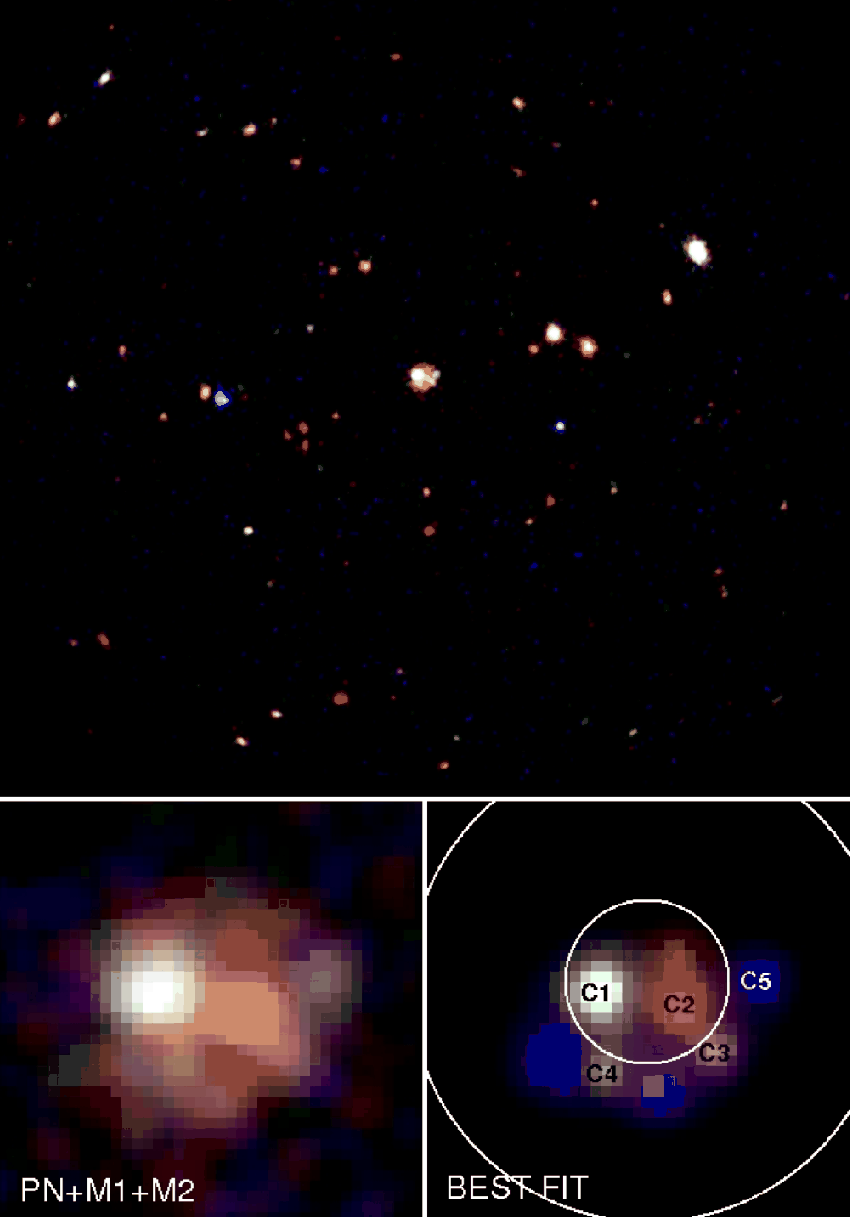 |
Figure 2:
Top: XMM-Newton observation of NGC 2808. Colours correspond to different energy bands, red: 0.5-1.5 keV, green: 1.5-3 keV, blue: 3-10 keV. The field of view is 30 |
| Open with DEXTER | |
In the text
![\begin{figure}
\par\includegraphics[height=8.4cm,clip]{8327fig3.eps}
\end{figure}](/articles/aa/full/2008/11/aa8327-07/img56.gif) |
Figure 3:
Contour map of the XMM-Newton MOS2 observation of NGC 4372. Core and half-mass radii are shown. The detected sources are plotted with their 90% error circles and with contours at 3, 5 and |
| Open with DEXTER | |
In the text
![\begin{figure}
\par\includegraphics[width=8.2cm,clip]{8327fig4.ps}
\end{figure}](/articles/aa/full/2008/11/aa8327-07/img68.gif) |
Figure 4:
|
| Open with DEXTER | |
In the text
![\begin{figure}
\par\includegraphics[width=8.2cm,clip]{8327fig5.ps}
\end{figure}](/articles/aa/full/2008/11/aa8327-07/img71.gif) |
Figure 5:
Flux-colour diagram of NGC 2808 sources. For clarity, only the 30 brightest sources are enumerated, the flux values for all the sources are listed in Table 2. R is the count rate for the given energy band in keV. A typical error bar is shown at the bottom right. Black lines represent the following models, assuming an absorption of
|
| Open with DEXTER | |
In the text
![\begin{figure}
\par\includegraphics[width=8.2cm,clip]{8327fig6.ps}
\end{figure}](/articles/aa/full/2008/11/aa8327-07/img73.gif) |
Figure 6:
Colour-colour diagram of NGC 2808 sources. Same comments as for Fig. 5.
PO: power law with photon indices 3, 2.5, 2, 1.5, 1, 0.5. BR: thermal bremsstrahlung with temperatures 1, 5, 10, 15, 20, 50 keV. BB: blackbody spectrum with temperatures 0.1, 0.5, 1, 1.5, 2 keV. NSA: neutron star with hydrogen atmosphere, mass
|
| Open with DEXTER | |
In the text
![\begin{figure}
\par\includegraphics[width=8.5cm,clip]{8327fig7.ps}
\end{figure}](/articles/aa/full/2008/11/aa8327-07/img74.gif) |
Figure 7: Spectrum of C1 (NGC 2808) fitted with a power law model and the absorption of the cluster. |
| Open with DEXTER | |
In the text
![\begin{figure}
\par\includegraphics[width=8.5cm,clip]{8327fig8.ps}
\end{figure}](/articles/aa/full/2008/11/aa8327-07/img75.gif) |
Figure 8: Spectrum of C2 (NGC 2808) fitted with a NSA model and the absorption of the cluster. The contribution of C1 also appears as a power law. |
| Open with DEXTER | |
In the text
| |
Figure 9: Lightcurve of source 1 (NGC 2808) and corresponding good time intervals (GTI) as defined in Sect. 2.1. Start time t0 is February 1st 2005 4:57:28 (MJD 2 453 402.70657). |
| Open with DEXTER | |
In the text
![\begin{figure}
\par\includegraphics[width=8cm,clip]{8327figa.eps}
\end{figure}](/articles/aa/full/2008/11/aa8327-07/img126.gif) |
Figure 10: Flux-colour diagram of NGC 4372 sources detected with XMM-Newton (crosses, units on the left axis) and ROSAT (diamonds, units on the right axis). R is the count rate for the given energy band in keV. Typical error bars are shown at the bottom left. |
| Open with DEXTER | |
In the text