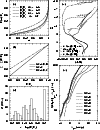
 |
Figure 1:
Model star cluster specifications. Panel a): a random selection of n in the
range
|
| Open with DEXTER | |
In the text
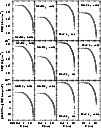 |
Figure 2: A selection of RDPs ( top panels), MDPs ( middle) and 2MASS J magnitude SBPs ( bottom) that illustrate structural changes under different magnitude depths. Arbitrary units (au) are used both for the radial coordinate and projected area. |
| Open with DEXTER | |
In the text
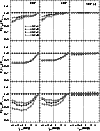 |
Figure 3:
Structural parameters of the GC models. Top panels: ratio of the tidal radius measured
in profiles with a photometric depth
|
| Open with DEXTER | |
In the text
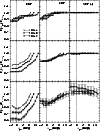 |
Figure 4: Same as Fig. 3 for the OC models. For comparison purposes, the y-scale is the same as in Fig. 3. Similarly to the GC models, radii changes are conspicuous in the RDPs and MDPs. |
| Open with DEXTER | |
In the text
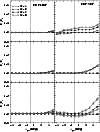 |
Figure 5: GC model profiles. Ratio between the same type of radii as measured in RDPs and MDPs ( left panels) and RDPs and SBPs ( right panels). From top to bottom: tidal, half and core radii. TO values are indicated by the dotted line. |
| Open with DEXTER | |
In the text
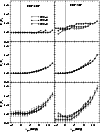 |
Figure 6: Same as Fig. 5 for the OC models. For comparison purposes, the y-scale is the same as in Fig. 5. |
| Open with DEXTER | |
In the text
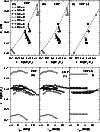 |
Figure 7:
Top panels: relation of the half-type radii with the concentration parameter,
for the RDPs ( left panel), MDPs ( middle) and SBPs ( right). For each model, Rh values
increase for deeper profiles. Dashed line in panels a) and b):
|
| Open with DEXTER | |
In the text
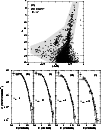 |
Figure 8:
Structural analysis of NGC 6397. Panel a): decontaminated CMD of a central
(
|
| Open with DEXTER | |
In the text
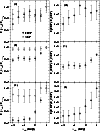 |
Figure 9:
Left panels: RDP and SBP structural radii of NGC 6397 as a function of
|
| Open with DEXTER | |
In the text