A&A 475, 843-849 (2007)
DOI: 10.1051/0004-6361:20078181
N. Mauron1 - K. S. Gigoyan2 - T. R. Kendall3
1 - GRAAL, CNRS and Université Montpellier II,
Place Bataillon, 34095 Montpellier, France
2 -
378433 Byurakan Astrophysical Observatory and Isaac
Newton Institute of Chile, Armenian Branch, Ashtarak d-ct, Armenia
3 -
Centre for Astrophysics Research, Science and Technology Research Institute,
University of Hertfordshire, College Lane, Hatfield AL10 9AB, UK
Received 28 June 2007 / Accepted 23 August 2007
Abstract
Aims. The goal of this paper is to present and analyse a new sample of cool carbon (C) stars located in the Galactic halo.
Methods. These rare objects are discovered by searching the 2MASS point-source catalogue for candidates having near-infrared colours typical of C stars. Optical spectroscopy is subsequently performed.
Results. Twenty-three new C stars were discovered, with their ![]() magnitude in the range 6 to 13.3. Spectra are typical of N-type carbon stars with C2 and CN bands and sometimes H
magnitude in the range 6 to 13.3. Spectra are typical of N-type carbon stars with C2 and CN bands and sometimes H![]() in emission. One object is a S-type star. When the objects are bright enough (
in emission. One object is a S-type star. When the objects are bright enough (
![]() ), the data of the Northern Sky Variability Survey can be exploited. In all cases, stars belonging to this survey show light variations confirming that they are AGB stars. Distances and galactocentric XYZ coordinates have been estimated by assuming these stars to be similar in luminosity to those of the Sagittarius dwarf galaxy. Four objects are particularly red with J-
), the data of the Northern Sky Variability Survey can be exploited. In all cases, stars belonging to this survey show light variations confirming that they are AGB stars. Distances and galactocentric XYZ coordinates have been estimated by assuming these stars to be similar in luminosity to those of the Sagittarius dwarf galaxy. Four objects are particularly red with J-
![]() ,
with two located at more than 5 kpc from the Galactic plane. Eight additional objects with similar properties are found in the literature and our previous works. These 12 C stars could be useful to study mass loss at low metallicity. Two other objects are remarkably far from the Sun, at distances of 95 and 110 kpc. They are located, together with two other C stars previously found, in the region Z < -60 kpc in which the model of Law et al. (2005) predicts the Sgr Stream to have a loop.
,
with two located at more than 5 kpc from the Galactic plane. Eight additional objects with similar properties are found in the literature and our previous works. These 12 C stars could be useful to study mass loss at low metallicity. Two other objects are remarkably far from the Sun, at distances of 95 and 110 kpc. They are located, together with two other C stars previously found, in the region Z < -60 kpc in which the model of Law et al. (2005) predicts the Sgr Stream to have a loop.
Key words: stars: carbon - Galaxy: halo - Galaxy: stellar content
Cool carbon (C) stars are objects evolving on the asymptotic giant
branch (AGB). This is a brief phase of stellar evolution characterized
by high luminosity, low effective temperature, and the appearance at the
surface of the star of nuclear products fabricated in its internal layers
(for reviews on AGB and C stars, see Habing 1996; Wallerstein
& Knapp 1998).
The progenitors of these C stars have intermediate masses, from about
1.3 ![]() in most cases, up to about 4
in most cases, up to about 4 ![]() .
C stars are variable sources. They can be recognized by their
very red colours and the strong spectral features arising
from carbon-rich molecules. Because evolution on the AGB is fast,
they are not very abundant in the Galactic disc. However, because of
their luminosity, they have been detected and studied in many galaxies
of the Local Group and beyond. They are more numerous in systems
with an average low metallicity, and generally indicate the presence of an
intermediate age population (see for example Wallerstein & Knapp
1998; Van den Bergh 2000; Mouhcine & Lançon
2001; Groenewegen 2005).
.
C stars are variable sources. They can be recognized by their
very red colours and the strong spectral features arising
from carbon-rich molecules. Because evolution on the AGB is fast,
they are not very abundant in the Galactic disc. However, because of
their luminosity, they have been detected and studied in many galaxies
of the Local Group and beyond. They are more numerous in systems
with an average low metallicity, and generally indicate the presence of an
intermediate age population (see for example Wallerstein & Knapp
1998; Van den Bergh 2000; Mouhcine & Lançon
2001; Groenewegen 2005).
In the Galactic disc and close to the Sun, i.e. at distances less than
![]() 5 kpc, AGB C stars have a scale height of 200 pc
(Claussen et al. 1987; Groenewegen et al. 1992;
Bergeat et al. 2002).
Therefore, very few of them are expected at more than about
5 kpc, AGB C stars have a scale height of 200 pc
(Claussen et al. 1987; Groenewegen et al. 1992;
Bergeat et al. 2002).
Therefore, very few of them are expected at more than about
![]() 1 kpc
above or below the Galactic plane. In the old halo population, all stars with masses
similar to those of C stars have evolved beyond the luminous AGB phase.
However, it has long been known that some faint and
cool carbon stars do exist at large distances and at high galactic latitude.
Totten and Irwin (1998, hereafter TI98) listed 41 previously known objects,
this number including some warmer CH-type objects.
They discovered 36 additional cases, with 29 N-type and 7 CH-type (for more
information about classification of C stars, see Wallerstein & Knapp 1998).
One of their goals was to show that these halo C stars might arise from
the disruption of dwarf galaxies captured by the Galaxy. This was
eventually proved by Ibata et al. (2001) who found that more than half of
these C stars are coherently clustered on a great circle on the sky, and
trace the debris stream of the Sagittarius dwarf galaxy.
1 kpc
above or below the Galactic plane. In the old halo population, all stars with masses
similar to those of C stars have evolved beyond the luminous AGB phase.
However, it has long been known that some faint and
cool carbon stars do exist at large distances and at high galactic latitude.
Totten and Irwin (1998, hereafter TI98) listed 41 previously known objects,
this number including some warmer CH-type objects.
They discovered 36 additional cases, with 29 N-type and 7 CH-type (for more
information about classification of C stars, see Wallerstein & Knapp 1998).
One of their goals was to show that these halo C stars might arise from
the disruption of dwarf galaxies captured by the Galaxy. This was
eventually proved by Ibata et al. (2001) who found that more than half of
these C stars are coherently clustered on a great circle on the sky, and
trace the debris stream of the Sagittarius dwarf galaxy.
The goal of this paper is to present new discoveries of halo cool C stars
and to study their properties.
In our previous works (Mauron et al. 2004, 2005), we
followed the approach of TI98 to search for these rare
halo cool C stars. However, rather than using visible photometry from
photographic plates to select candidates,
we have exploited the recent 2MASS near-infrared survey
and its point-source catalogue (Cutri et al. 2003).
This survey provides us with accurate
![]() photometry,
enabling the potential discovery of C stars via their near-infrared colours.
Follow-up spectroscopy is then performed to determine whether these candidates are
carbon-rich, and show the expected signatures of evolved AGB objects.
photometry,
enabling the potential discovery of C stars via their near-infrared colours.
Follow-up spectroscopy is then performed to determine whether these candidates are
carbon-rich, and show the expected signatures of evolved AGB objects.
A first result of our research was that
50 new cool halo C stars were discovered.
This suggested that, firstly, the
observational strategy was correct (for details on the candidate selection process,
see Mauron et al. 2005). Secondly, it was found that a majority
of these objects belong to the Sagittarius (Sgr) stream, but not all of them do,
in agreement with previous findings. Finally, we found several remarkably
faint (
![]() )
objects; interesting probes
of the halo at distances from the Sun as large as
)
objects; interesting probes
of the halo at distances from the Sun as large as ![]() 60-120 kpc.
60-120 kpc.
In this paper, we report on our continuing program to enlarge the sample
of these halo C stars. We wish eventually to establish a complete
![]() -band limited inventory. Two new very distant sources
were discovered with
-band limited inventory. Two new very distant sources
were discovered with
![]() .
Observations and data reduction are described in Sect. 2.
In Sect. 3 we analyse our new sample of 25 halo C stars, and we discuss
global properties of the sample and individual
cases, including consideration of colours, spectra and variability. Very red
sources are discussed in Sect. 4. In Sect. 5,
we estimate the distances of the sources and discuss their location
in the Galactic halo. A summary of this work and our conclusions are finally
given in Sect. 6.
.
Observations and data reduction are described in Sect. 2.
In Sect. 3 we analyse our new sample of 25 halo C stars, and we discuss
global properties of the sample and individual
cases, including consideration of colours, spectra and variability. Very red
sources are discussed in Sect. 4. In Sect. 5,
we estimate the distances of the sources and discuss their location
in the Galactic halo. A summary of this work and our conclusions are finally
given in Sect. 6.
At Haute-Provence, the observations were made during the nights
September 5 to 9, 2005 and September 27 to October 2, 2006.
The instrument was the CARELEC spectrograph mounted
at the Cassegrain focus of the 1.93-m telescope. The spectrograph
was used with a 150 g mm-1 grating and an EEV 2048![]() 1024
CCD chip with 13.5
1024
CCD chip with 13.5![]() 13.5
13.5 ![]() m pixels.
The dispersion is 3.6 Å per pixel. The slit width was
2.0 arcsec. The resolving power is
m pixels.
The dispersion is 3.6 Å per pixel. The slit width was
2.0 arcsec. The resolving power is
![]() = 460, and
= 460, and
![]() = 13 Å at 6000 Å , with a spectral coverage of
4400 to 8400 Å.
= 13 Å at 6000 Å , with a spectral coverage of
4400 to 8400 Å.
Typical exposure times were from about 1 minute for the brightest candidate
carbon stars (![]() )
to about 1 h for the faintest ones
(
)
to about 1 h for the faintest ones
(![]() ). The low spectral resolution was chosen to allow
spectroscopy of these faint stars in a reasonable time, and the
spectra have sufficient signal to noise ratio (
). The low spectral resolution was chosen to allow
spectroscopy of these faint stars in a reasonable time, and the
spectra have sufficient signal to noise ratio (![]() 20) to
perfectly recognize
the strong molecular features of carbon-rich objects. Most of the
contaminants in our list of C candidates are cool M giants or M dwarfs.
Faint sources required clear conditions
with good seeing. When these conditions were not fulfilled, only bright
sources were observed.
20) to
perfectly recognize
the strong molecular features of carbon-rich objects. Most of the
contaminants in our list of C candidates are cool M giants or M dwarfs.
Faint sources required clear conditions
with good seeing. When these conditions were not fulfilled, only bright
sources were observed.
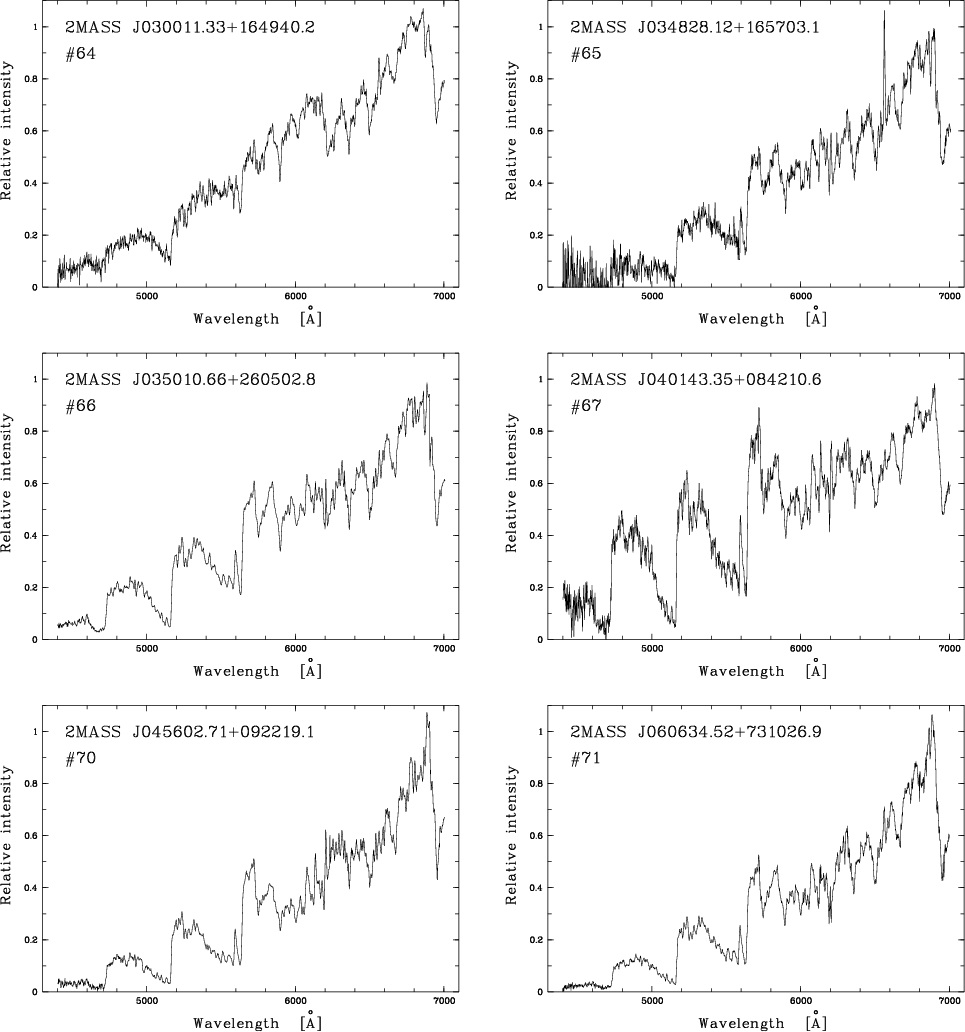
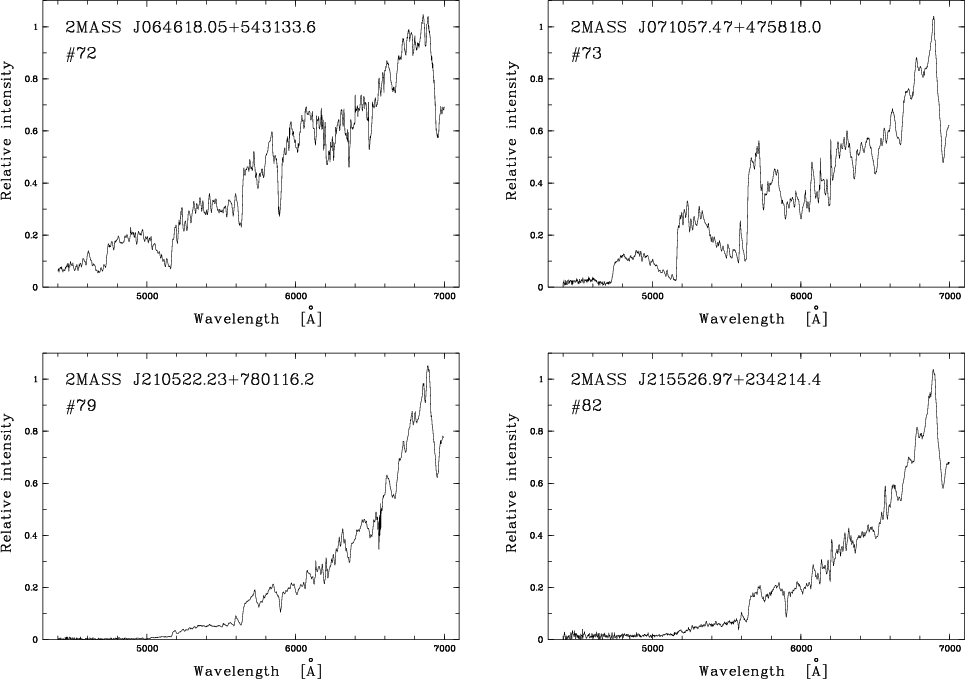
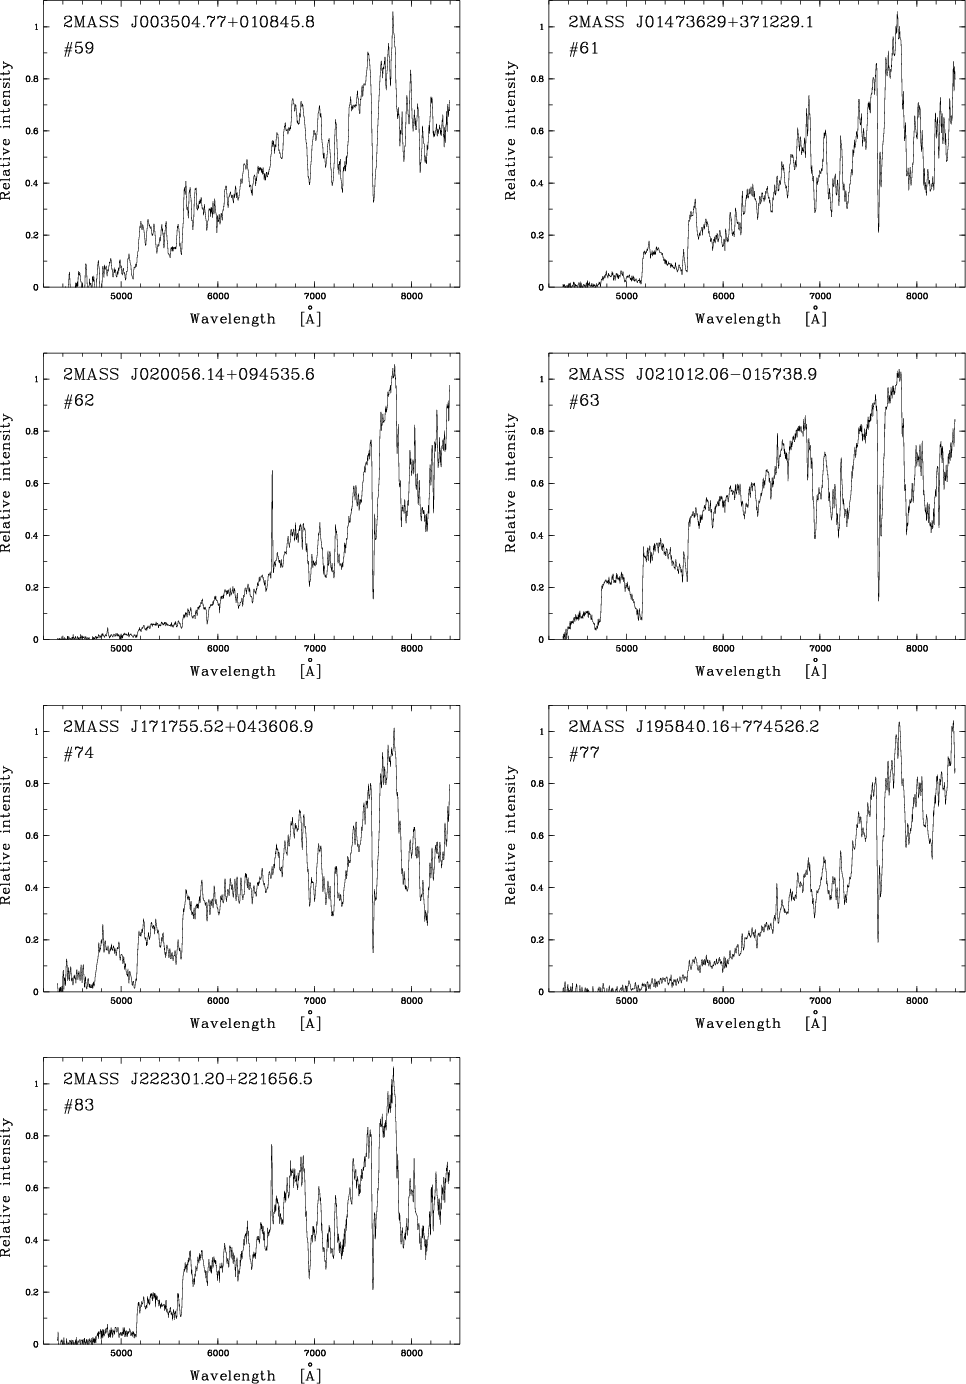
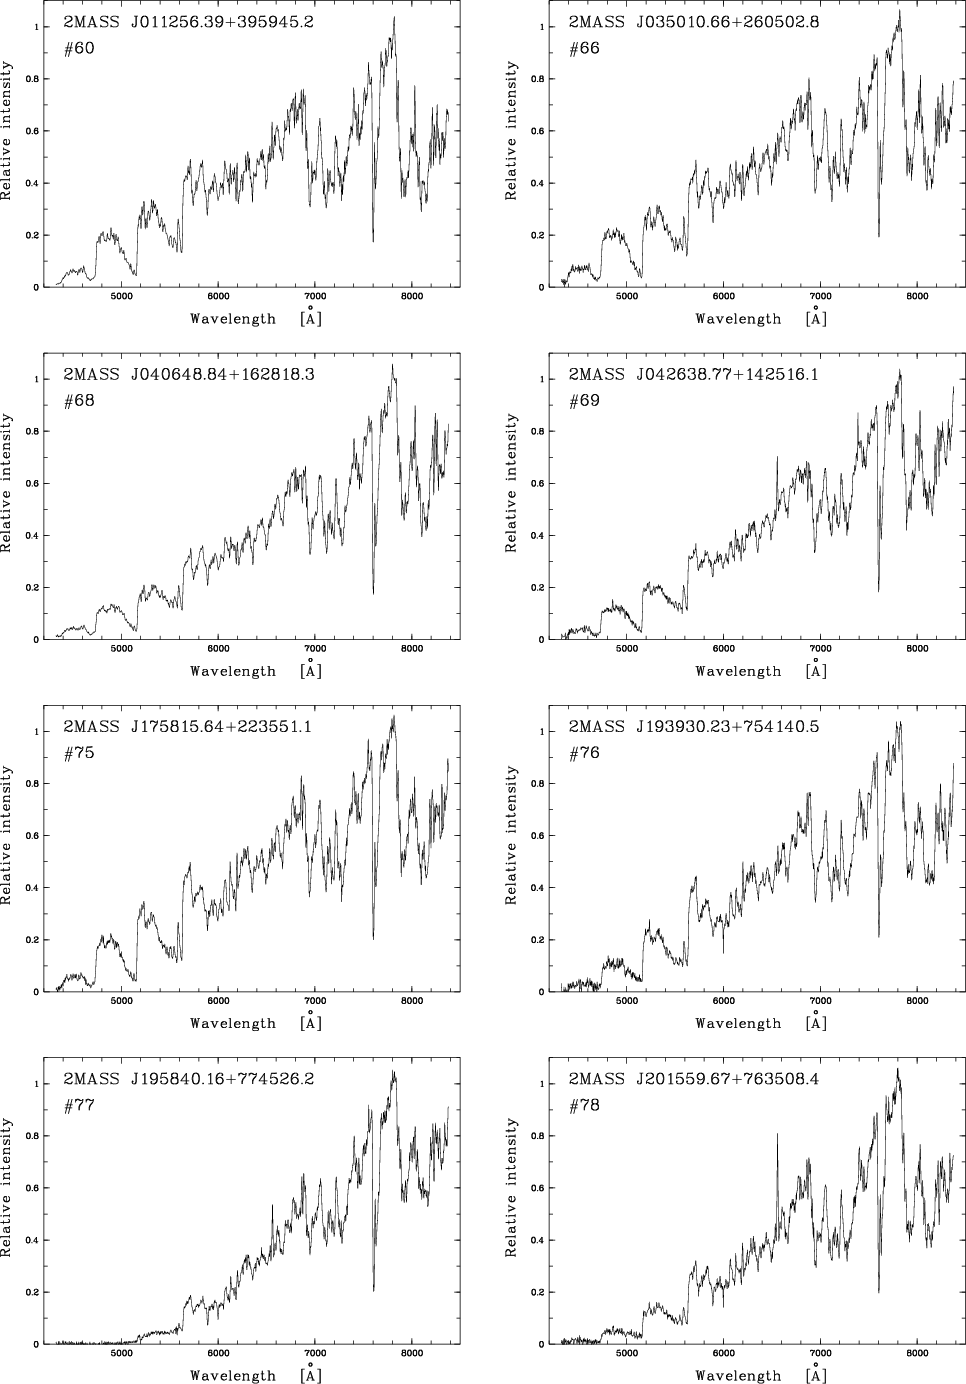
Standard data reduction for slit spectroscopy was carried out with the ESO Midas software. It included bias subtraction, flat-fielding, extraction of one-dimensional spectra for the object and for the sky, subtraction of the sky spectrum, cleaning of cosmic rays, and wavelength calibration. Then, a correction was applied to take into account the instrumental spectral efficiency, and this was done with the spectrum of a standard photometric star observed with the same instrumental set-up. The spectra are thus proportional to a flux expressed in erg s-1 cm-2 Å-1 and can be compared to those shown by TI98. However, no absolute calibration could be achieved because the sky was most of the time not photometric, and because strong slit losses occured when the seeing was bad. Therefore, only relative spectral distributions can finally be considered and are drawn in our plots.
| No. | 2MASS name | l | b | B | R | B-R | J | H |
|
Note | |
| 59 | 2MASS J003504.77+010845.8 | 114.351 | -61.453 | 19.2 | 16.7 | 2.5 | 14.620 | 13.734 | 13.280 | 1.340 | |
| 60 | 2MASS J011256.39+395945.3 | 127.393 | -22.689 | 15.1 | 11.3 | 3.8 | 8.181 | 7.160 | 6.725 | 1.456 | |
| 61 | 2MASS J014736.29+371229.1 | 135.175 | -24.325 | 17.4 | 13.3 | 4.1 | 10.523 | 9.436 | 8.884 | 1.639 | |
| 62 | 2MASS J020056.14+094535.6 | 149.845 | -49.446 | 19.7 | 15.2 | 4.5 | 10.266 | 8.525 | 7.170 | 3.096 | |
| 63 | 2MASS J021012.06-015738.9 | 163.123 | -58.546 | 16.2 | 12.2 | 4.0 | 11.505 | 10.605 | 10.010 | 1.495 | 1 |
| 64 | 2MASS J030011.33+164940.2 | 162.049 | -36.082 | 17.5 | 14.2 | 3.3 | 11.632 | 10.742 | 10.293 | 1.339 | |
| 65 | 2MASS J034828.12+165703.2 | 172.347 | -28.475 | 18.1 | 14.8 | 3.3 | 13.098 | 11.903 | 11.097 | 2.001 | |
| 66 | 2MASS J035010.66+260502.8 | 165.713 | -21.582 | 16.7 | 13.3 | 4.4 | 10.240 | 9.244 | 8.803 | 1.437 | |
| 67 | 2MASS J040143.35+084210.6 | 181.911 | -31.637 | 16.1 | 12.6 | 3.5 | 9.765 | 8.703 | 8.195 | 1.570 | |
| 68 | 2MASS J040648.84+162818.3 | 176.133 | -25.619 | 16.9 | 13.0 | 3.9 | 9.573 | 8.517 | 8.036 | 1.537 | |
| 69 | 2MASS J042638.77+142516.1 | 181.245 | -23.296 | 19.2 | 17.1 | 2.1 | 13.215 | 12.030 | 11.204 | 2.011 | 2 |
| 70 | 2MASS J045602.71+092219.1 | 190.204 | -20.452 | 17.3 | 13.4 | 3.9 | 10.189 | 9.141 | 8.599 | 1.590 | |
| 71 | 2MASS J060634.52+731026.9 | 140.861 | +22.738 | 15.9 | 12.7 | 3.2 | 9.403 | 8.393 | 7.891 | 1.512 | |
| 72 | 2MASS J064618.05+543133.6 | 161.381 | +21.086 | 14.8 | 12.8 | 2.0 | 9.478 | 8.458 | 8.072 | 1.406 | |
| 73 | 2MASS J071057.47+475818.0 | 169.337 | +22.917 | 16.1 | 12.3 | 3.8 | 8.935 | 7.880 | 7.352 | 1.583 | |
| 74 | 2MASS J171755.52+043606.9 | 26.142 | +22.867 | 17.3 | 14.5 | 2.8 | 11.557 | 10.592 | 10.200 | 1.357 | |
| 75 | 2MASS J175815.64+223551.1 | 48.195 | +21.356 | 15.7 | 12.0 | 3.7 | 9.516 | 8.632 | 8.073 | 1.443 | |
| 76 | 2MASS J193930.23+754140.5 | 107.672 | +23.332 | 16.2 | 12.5 | 3.7 | 9.426 | 8.326 | 7.783 | 1.643 | |
| 77 | 2MASS J195840.16+774526.2 | 110.190 | +23.019 | 21.0 | 14.9 | 6.1 | 12.048 | 10.161 | 8.692 | 3.356 | |
| 78 | 2MASS J201559.67+763508.4 | 109.469 | +21.659 | 16.9 | 12.9 | 4.0 | 9.553 | 8.573 | 7.978 | 1.575 | |
| 79 | 2MASS J210522.23+780116.2 | 112.308 | +20.130 | 17.0 | 13.0 | 4.0 | 9.779 | 7.699 | 6.116 | 3.663 | |
| 80 | 2MASS J211944.93+180029.7 | 68.200 | -21.673 | 18.1 | 13.6 | 4.5 | 8.671 | 7.338 | 6.364 | 2.307 | 3 |
| 81 | 2MASS J212318.24-140819.5 | 37.019 | -39.965 | 18.7 | 16.3 | 2.4 | 14.281 | 13.427 | 12.862 | 1.419 | |
| 82 | 2MASS J215526.97+234214.4 | 78.911 | -23.760 | 18.3 | 14.0 | 4.3 | 8.901 | 6.986 | 5.503 | 3.398 | |
| 83 | 2MASS J222301.20+221656.5 | 83.298 | -28.940 | 20.2 | 15.0 | 5.2 | 11.685 | 10.392 | 9.524 | 2.161 |
| Notes: (1) carbon star identified by TI98. It was reobserved because of its peculiar blue index B-R = -0.6 in USNOC-A2.0; (2) carbon star identified by Cruz et al. (2003). A first spectrum is shown in this work; (3) this object is a S-type evolved object. |
![\begin{figure}
\par\includegraphics[angle=-90,width=7.8cm,clip]{8181f01.ps}\end{figure}](/articles/aa/full/2007/45/aa8181-07/img23.gif) |
Figure 1:
Colour-magnitude diagram with |
Table 1 lists the main parameters of the 25 objects that are under
analysis in this work. In the first column, the object serial number is given,
following the numbering of Table 1 of Mauron et al. (2005).
Coordinates ![]() and
and ![]() (J2000) are given in the object 2MASS J
names as HHMMSS.ss
(J2000) are given in the object 2MASS J
names as HHMMSS.ss![]() DDMMSS.s. The quantities l, b are galactic coordinates
in degrees. The B & R magnitudes are from the USNO-A2.0 catalogue
(Monet et al. 1998) as given in the 2MASS catalogue. If these data are not
available, we have adopted the B and R values given in the APM database
(Irwin 2000), or we
have estimated them from the USNO-B1.0 data (Monet et al. 2003).
Uncertainties on B and R of the order of 0.4 mag (1
DDMMSS.s. The quantities l, b are galactic coordinates
in degrees. The B & R magnitudes are from the USNO-A2.0 catalogue
(Monet et al. 1998) as given in the 2MASS catalogue. If these data are not
available, we have adopted the B and R values given in the APM database
(Irwin 2000), or we
have estimated them from the USNO-B1.0 data (Monet et al. 2003).
Uncertainties on B and R of the order of 0.4 mag (1![]() ). The
). The
![]() magnitudes and the J-
magnitudes and the J-![]() colour are from the 2MASS catalogue, with
uncertainties on
colour are from the 2MASS catalogue, with
uncertainties on
![]() of about 0.02-0.03 mag in most cases.
of about 0.02-0.03 mag in most cases.
One can see in Table 1 that the R magnitudes are in the range ![]() 11 up
to
11 up
to ![]() 17. Nine sources are brighter than R=13.0 and three are fainter
than 16.0. The B - R colour is often greater than 3.0 . More precisely, of
the 25 objects, 20 have their B - R greater than 3.0. Here, it is interesting
to note that if B - R had been requested to be larger than 3.0 in our selection
process, we would have missed the two most interesting objects (#59 and #81),
with the faintest
17. Nine sources are brighter than R=13.0 and three are fainter
than 16.0. The B - R colour is often greater than 3.0 . More precisely, of
the 25 objects, 20 have their B - R greater than 3.0. Here, it is interesting
to note that if B - R had been requested to be larger than 3.0 in our selection
process, we would have missed the two most interesting objects (#59 and #81),
with the faintest ![]() magnitude and the largest distances (see below).
magnitude and the largest distances (see below).
The listed ![]() magnitudes cover the range
magnitudes cover the range ![]() 6 to
6 to ![]() 13.
All objects have
13.
All objects have
![]() > 1.30.
Figure 1 shows the colour-magnitude diagram of our sample. The objects of
Table 1 are plotted with filled circles. The encircled crosses
show the 77 objects listed in TI98, and the empty circles indicate
objects found in previous works aimed at discovering new faint and cool halo C stars
(e.g., Mauron et al. 2004, 2005;
Liebert et al. 2000). The vertical line at
J -
> 1.30.
Figure 1 shows the colour-magnitude diagram of our sample. The objects of
Table 1 are plotted with filled circles. The encircled crosses
show the 77 objects listed in TI98, and the empty circles indicate
objects found in previous works aimed at discovering new faint and cool halo C stars
(e.g., Mauron et al. 2004, 2005;
Liebert et al. 2000). The vertical line at
J - ![]() = 1.20 is the approximate limit between CH-type stars at
left and cool AGB C stars at right. Only cool N-type objects were
searched in the present study. In this diagram, a cool C star located at a
distance of 50 kpc like the Large Magellanic Cloud (hereafter LMC) has
a typical magnitude
= 1.20 is the approximate limit between CH-type stars at
left and cool AGB C stars at right. Only cool N-type objects were
searched in the present study. In this diagram, a cool C star located at a
distance of 50 kpc like the Large Magellanic Cloud (hereafter LMC) has
a typical magnitude
![]() .
One can note in Fig. 1 that the number of objects in the
upper right region
.
One can note in Fig. 1 that the number of objects in the
upper right region
![]() ,
,
![]() has progressively
increased, with in particular two objects, #59 and #83,
which have
has progressively
increased, with in particular two objects, #59 and #83,
which have
![]() and
and
![]() respectively.
respectively.
There are two objects that were already known as carbon stars. One is #63,
that was already in TI98
under the name C*30 or APM 0207-0211.
It was reexamined by us because of its intriguing colour
B - R = -0.6 in
the USNO-A2.0 catalog. Usually, this colour for cool C stars covers the range
from 2.5 to ![]() 4, or even redder. We wished to detect a possible
blue excess near 4500 Å , but found none. Our spectrum is very similar to
that of TI98, the only difference being the presence of a small H
4, or even redder. We wished to detect a possible
blue excess near 4500 Å , but found none. Our spectrum is very similar to
that of TI98, the only difference being the presence of a small H![]() emission at 6563 Å . Because the APM catalogue gives R=12.16
and
BJ - R = 4.08 (adopted in Table 1), our conclusion is that
the USNO-A2.0 data is probably simply flawed.
emission at 6563 Å . Because the APM catalogue gives R=12.16
and
BJ - R = 4.08 (adopted in Table 1), our conclusion is that
the USNO-A2.0 data is probably simply flawed.
The other object which was known as a C star
is #69. This object was found by Cruz et al. (2003) during their
search for brown dwarfs. It was observed by us to obtain a first spectrum
and because it was faint, ![]() = 11.2, implying a large distance.
= 11.2, implying a large distance.
All obtained spectra are presented in the on-line Appendix. In Fig. 2, we
show only the spectrum of the most distant star (#59). This
spectrum has the lowest S/N in our sample, but the characteristics of
a cool C star, such as a rising continuum and the C2 and CN bands, are
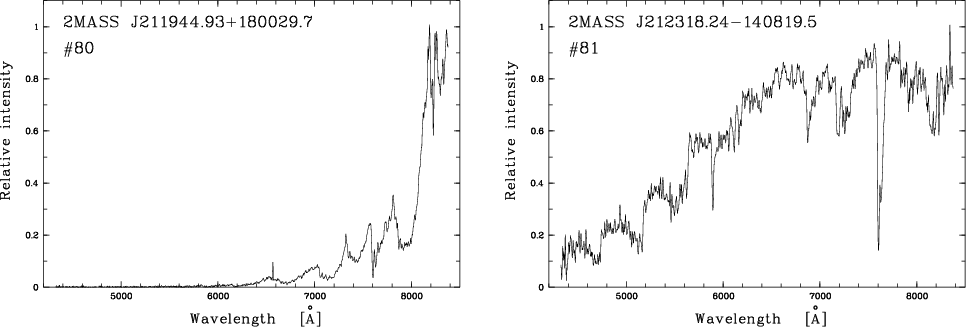
obvious. One object, #80, is a S-type star, with strong VO
absorption near 7400 Å . Its H![]() (6563 Å ) line is in emission
and this star displays important light variations (see below). Of the 25 C
stars observed, 10 show the H
(6563 Å ) line is in emission
and this star displays important light variations (see below). Of the 25 C
stars observed, 10 show the H![]() line
in emission, representing 40% of the sample, which is in agreement with
previous findings of Mauron et al. (2004, 2005).
line
in emission, representing 40% of the sample, which is in agreement with
previous findings of Mauron et al. (2004, 2005).
In order to study variability of our objects, we have considered the Northern Sky
Variability Survey (NSVS) of Wozniak et al. (2004). This survey
provides light curves for sources with V-band magnitudes of 8 to ![]() 15.5.
The length of each record is typically 300 days. Some data points are obvious
outliers and should be ignored. Only the general trend of the light curves must be
considered. Not all the objects
in our sample have a counterpart in the NSVS, especially the faintest ones.
In all cases in which data is available and sufficiently numerous,
they suggest regular or irregular variations with V-band amplitudes of
about 1 mag. up to several magnitudes.
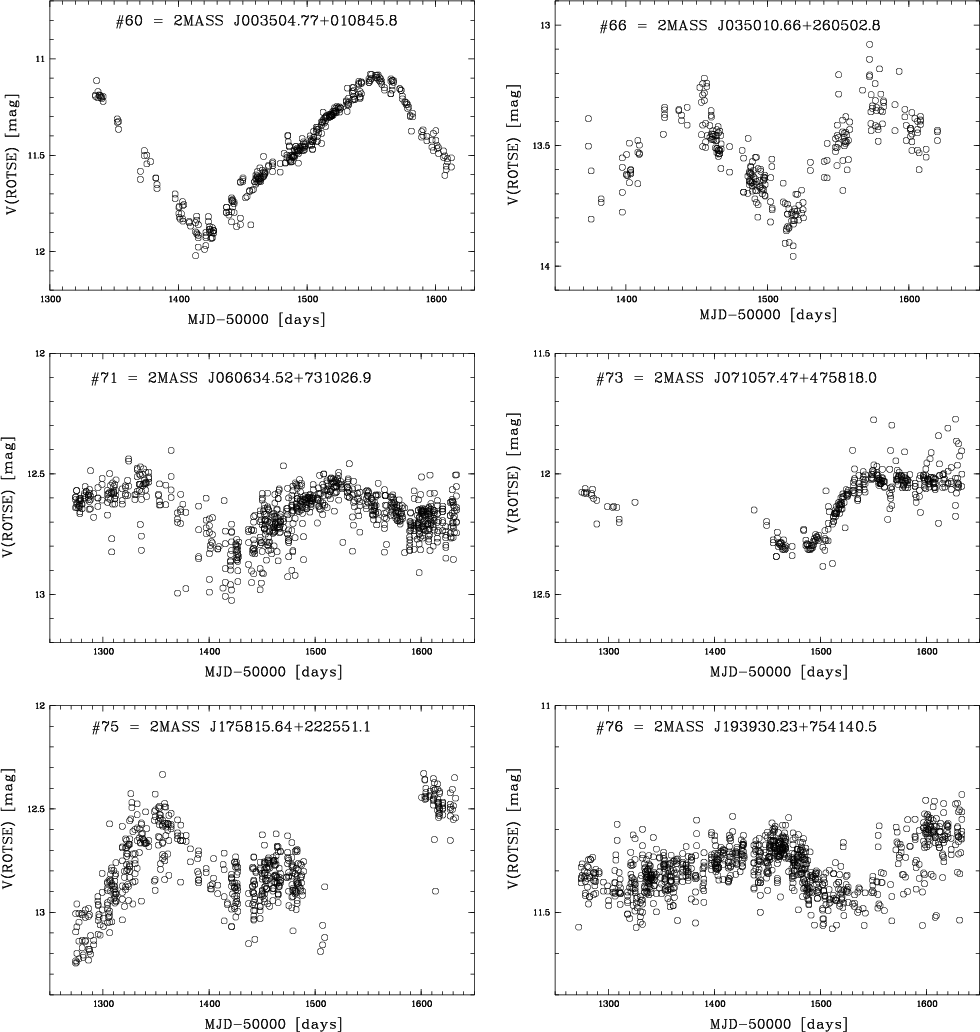
For illustration, Fig. 3 shows the light curves of objects #60 and #78.
Light curves for objects # 66, 71, 73, 75, 76, 78, 79, 80, 82, and 83
are given in the on-line appendix. Note that the S star (# 80)
displays the largest variation and linearly decreases from V=12.5 to V=15.0
over a period of 200 days.
15.5.
The length of each record is typically 300 days. Some data points are obvious
outliers and should be ignored. Only the general trend of the light curves must be
considered. Not all the objects
in our sample have a counterpart in the NSVS, especially the faintest ones.
In all cases in which data is available and sufficiently numerous,
they suggest regular or irregular variations with V-band amplitudes of
about 1 mag. up to several magnitudes.
For illustration, Fig. 3 shows the light curves of objects #60 and #78.
Light curves for objects # 66, 71, 73, 75, 76, 78, 79, 80, 82, and 83
are given in the on-line appendix. Note that the S star (# 80)
displays the largest variation and linearly decreases from V=12.5 to V=15.0
over a period of 200 days.
![\begin{figure}
\par\includegraphics[angle=-90,width=7cm,clip]{8181f03a.ps}\vspace*{2mm}
\includegraphics[angle=-90,width=7cm,clip]{8181f03b.ps}\end{figure}](/articles/aa/full/2007/45/aa8181-07/img33.gif) |
Figure 3: Light curves for objects #60 and #78, from NSVS data. Only the general trend should be considered and a few outliers have to be ignored. |
One of the result of this paper is the discovery
of four very red C stars
seen in Fig. 1 as filled circles with J - ![]() between 3 and 4.
By searching the literature about high latitude, cool and faint C stars,
we have found 8 other objects out of the Galactic plane
having a similarly red J -
between 3 and 4.
By searching the literature about high latitude, cool and faint C stars,
we have found 8 other objects out of the Galactic plane
having a similarly red J - ![]() colour,
colour, ![]()
![]() 5.5,
and |b| > 20
5.5,
and |b| > 20![]() .
In our research for these stars, we also
require the IRAS 12
.
In our research for these stars, we also
require the IRAS 12 ![]() m flux to be less than
m flux to be less than
![]() 7 Jy in order to exclude nearby,
very dusty objects like IRC+10216 or AFGL 3068.
The data for this sample of 12 cases are listed in Table 2.
Object #82 has no 12
7 Jy in order to exclude nearby,
very dusty objects like IRC+10216 or AFGL 3068.
The data for this sample of 12 cases are listed in Table 2.
Object #82 has no 12 ![]() m flux because IRAS scans do not pass over a
narrow lane in which this source lies. For 2MASS J194850.65-305831.7,
the 12
m flux because IRAS scans do not pass over a
narrow lane in which this source lies. For 2MASS J194850.65-305831.7,
the 12 ![]() m data is a conservative upper limit derived from the
examination of the IRAS Faint Source catalogue sources close to it.
Distances to the Sun and from the Galactic plane were derived
as explained below. One can see that the stars #79 and #82 are
moderatly out of the plane by 1.3 kpc, but all others are clearly at
very large heights, and this remains true even if our distances are
overestimated by
m data is a conservative upper limit derived from the
examination of the IRAS Faint Source catalogue sources close to it.
Distances to the Sun and from the Galactic plane were derived
as explained below. One can see that the stars #79 and #82 are
moderatly out of the plane by 1.3 kpc, but all others are clearly at
very large heights, and this remains true even if our distances are
overestimated by ![]() 40% (-2
40% (-2![]() ,
see next section).
,
see next section).
The best studied case is IRAS 12560+1656, discovered by Beichman
et al. (1990) in a sample of faint IRAS sources located
at high b and having faint counterparts in the POSS plates.
This object has been further investigated by
Groenewegen et al. (1997) who found
a remarkably low expansion velocity of its circumstellar envelope, measured
in CO (3 km s-1). They also found that this object is
deficient in oxygen relative to the Sun, by ![]() 0.7 dex.
IRAS 08546+1732, not detected in CO, is deficient as well.
Therefore, our 12 objects deserve interest because it is established
that already two of them are metal-poor, with one having very unusual
wind properties.
Because these 12 objects do not belong to the Galactic disc, they may
come from the debris of the Sgr dwarf and have a metal abundance
[Fe/H] around -1.0 (Van den Bergh 2000).
0.7 dex.
IRAS 08546+1732, not detected in CO, is deficient as well.
Therefore, our 12 objects deserve interest because it is established
that already two of them are metal-poor, with one having very unusual
wind properties.
Because these 12 objects do not belong to the Galactic disc, they may
come from the debris of the Sgr dwarf and have a metal abundance
[Fe/H] around -1.0 (Van den Bergh 2000).
Are their infrared colours different from those of C stars having
a much higher 12 ![]() m flux? In order to test that, we considered the
sample of 330 bright infrared C stars of Groenewegen
et al. (2002). Most of these stars are close to the Galactic plane
and might suffer some interstellar extinction in J and
m flux? In order to test that, we considered the
sample of 330 bright infrared C stars of Groenewegen
et al. (2002). Most of these stars are close to the Galactic plane
and might suffer some interstellar extinction in J and ![]() .
So we
selected a subsample of their stars with |b| > 10
.
So we
selected a subsample of their stars with |b| > 10![]() .
Their f12 fluxes are between 13 and 250 Jy. Figure 4 shows
the colour-colour plot with
.
Their f12 fluxes are between 13 and 250 Jy. Figure 4 shows
the colour-colour plot with
![]() versus
versus
![]() .
The [12] magnitude is taken to be zero for Vega, thus
[12] = -2.5 log10(f12/41.6), with f12 in Jy. This plot
shows that the objects in Table 2 are located on the sequence of ordinary
disc C stars going from
warm cases at lower left to very cool dusty objects at upper right.
The 12 objects of Table 2 do not seem different from brighter objects
as far as the J-
.
The [12] magnitude is taken to be zero for Vega, thus
[12] = -2.5 log10(f12/41.6), with f12 in Jy. This plot
shows that the objects in Table 2 are located on the sequence of ordinary
disc C stars going from
warm cases at lower left to very cool dusty objects at upper right.
The 12 objects of Table 2 do not seem different from brighter objects
as far as the J-![]() and
and ![]() -[12] colours are concerned.
-[12] colours are concerned.
To conclude, in addition to IRAS 12560+1656 and IRAS 08546+1732 quoted above, the 10 other stars of Table 2 may be useful to study mass loss of low metallicity AGB C stars. They are generally much closer to the Sun than similar carbon stars in the Magellanic Clouds.
| IRAS name | 2MASS name | l | b | f12 |
|
d | Z | Note | |
| (deg) | (deg) | (Jy) | (mag) | (mag) | (kpc) | (kpc) | - | ||
| 01582+0931 | 2MASS J020056.14+094535.6 | 149.845 | -49.446 | 2.27 | 7.17 | 3.06 | 7 | -5.5 | #62 |
| 03242+1429 | 2MASS J032659.91+143956.9 | 169.816 | -33.690 | 0.59 | 8.21 | 3.41 | 13 | -7.5 | 1 |
| 03582+1819 | 2MASS J040109.72+182808.1 | 173.496 | -25.252 | 1.06 | 9.25 | 4.66 | 17 | -7.5 | 1 |
| 04188+0122 | 2MASS J042127.25+012913.4 | 192.177 | -31.987 | 3.37 | 6.42 | 3.28 | 6 | -3.5 | 2 |
| 08427+0338 | 2MASS J084522.27+032711.2 | 223.486 | +26.816 | 6.50 | 6.25 | 3.41 | 6 | +2.5 | 3 |
| 08546+1732 | 2MASS J085725.82+172051.9 | 210.261 | +35.437 | 0.57 | 10.71 | 4.41 | 36 | +21.0 | 4 |
| 12560+1656 | 2MASS J125833.50+164012.2 | 312.253 | +79.413 | 0.77 | 7.82 | 3.48 | 11 | +11.0 | 5 |
| not IRAS | 2MASS J194850.65-305831.7 | 9.433 | -25.076 | <0.3 | 10.21 | 3.39 | 25 | -10.0 | 6 |
| 20005+7737 | 2MASS J195840.16+774526.2 | 110.190 | +23.019 | 0.50 | 8.69 | 3.35 | 14 | +5.5 | #77 |
| 20176-1458 | 2MASS J202027.66-144927.2 | 029.047 | -26.265 | 0.45 | 8.71 | 3.14 | 14 | -6.0 | 6 |
| 21064+7749 | 2MASS J210522.23+780116.2 | 112.308 | +20.130 | 5.88 | 6.12 | 3.66 | 4 | +1.3 | #79 |
| not IRAS | 2MASS J215526.97+234214.4 | 78.911 | -23.760 | - | 5.50 | 3.40 | 3 | -1.3 | #82 |
| Notes: (1) discovered by Liebert et al. (2000); (2) discovered by TI98 as APM 0418+0122; (3) this star is CGCS 6306 in the Catalogue of Galactic carbon stars, Alksnis et al. (2001); (4) discovered by Cutri et al. (1989); (5) discovered by Beichman et al. (1990); (6) discovered by Mauron et al. (2004). |
![\begin{figure}
\par\includegraphics[angle=-90,width=6.5cm,clip]{8181f04.ps}\end{figure}](/articles/aa/full/2007/45/aa8181-07/img36.gif) |
Figure 4:
Colour colour diagram
|
The distances of our objects were estimated by using their
observed J-![]() colour and
colour and ![]() magnitude.
The
magnitude.
The ![]() band is used because it is less sensitive to temporal variations
than other filters and suffers less interstellar extinction. Absolute magnitudes
were determined as in Mauron et al. (2004, 2005).
Briefly,
band is used because it is less sensitive to temporal variations
than other filters and suffers less interstellar extinction. Absolute magnitudes
were determined as in Mauron et al. (2004, 2005).
Briefly,
![]() values are obtained by considering the
values are obtained by considering the
![]() magnitudes of LMC carbon stars averaged over colour bins of 0.1 mag
and adding 0.5 mag. The colour-magnitude diagram
magnitudes of LMC carbon stars averaged over colour bins of 0.1 mag
and adding 0.5 mag. The colour-magnitude diagram ![]() versus
versus
![]() of the LMC can be seen in Fig. 3 of Nikolaev and Weinberg (2000). The
supplementary 0.5-mag term is due to the average
difference between C stars in the LMC and C stars in the Sgr dwarf
galaxy (see Mauron et al. 2004, for details). This calibration on the
C stars of Sgr is adopted because a majority of halo C stars originate
from this dwarf galaxy. If they were calibrated on LMC C stars, our
objects would have distances and Z values
of the LMC can be seen in Fig. 3 of Nikolaev and Weinberg (2000). The
supplementary 0.5-mag term is due to the average
difference between C stars in the LMC and C stars in the Sgr dwarf
galaxy (see Mauron et al. 2004, for details). This calibration on the
C stars of Sgr is adopted because a majority of halo C stars originate
from this dwarf galaxy. If they were calibrated on LMC C stars, our
objects would have distances and Z values ![]() 25% larger.
The scatter on the adopted absolute magnitude
25% larger.
The scatter on the adopted absolute magnitude
![]() is around
0.3-0.4 (1
is around
0.3-0.4 (1![]() ). Concerning the S star (# 80), it was assumed
that its
). Concerning the S star (# 80), it was assumed
that its
![]() was similar to that of C stars.
was similar to that of C stars.
For each star, interstellar colour excesses
EB-V were taken from the maps of Schlegel
et al. (1998) and a colour excess of 0.13 was adopted for LMC stars.
The J and ![]() extinctions were calculated as
AJ=0.902 EB-V and
extinctions were calculated as
AJ=0.902 EB-V and
![]() EB-V.
In general, these corrections for interstellar reddening are low,
but for a few stars EB-V is of the order of 0.5-0.6 mag,
so that
EB-V.
In general, these corrections for interstellar reddening are low,
but for a few stars EB-V is of the order of 0.5-0.6 mag,
so that
![]() reaches 0.2 mag and
cannot be neglected. Table 3 shows the adopted values of
EB-V, the dereddened colour (
reaches 0.2 mag and
cannot be neglected. Table 3 shows the adopted values of
EB-V, the dereddened colour (
![]() , the
absolute magnitude
, the
absolute magnitude
![]() and the derived
distance d in kpc. Due to the scatter on
and the derived
distance d in kpc. Due to the scatter on
![]() ,
the
uncertainty on distances is about 20 percent (1
,
the
uncertainty on distances is about 20 percent (1![]() ).
).
It can be seen in Table 3 that distances are
from ![]() 5 kpc to
5 kpc to ![]() 110 kpc. Two stars have d < 5 kpc,
15 have d between 5 and 20 kpc and 8 have d between 20 and 110 kpc.
Some of these distances could be improved in the future if the stars are
shown to be periodic variables. For example, if we assume that stars #60 and #78
(with light curves in Fig. 3) are periodic, we can apply the K-band
period-luminosity relation for
semiregular variables established by Knapp et al. (2003). The
NSVS light curves suggest that their periods could be 240 and 320 days,
respectively. Then, with the P-MK relation
MK = -1.34 log P -4.5, and assuming that
the (average) K magnitude is not too different from
110 kpc. Two stars have d < 5 kpc,
15 have d between 5 and 20 kpc and 8 have d between 20 and 110 kpc.
Some of these distances could be improved in the future if the stars are
shown to be periodic variables. For example, if we assume that stars #60 and #78
(with light curves in Fig. 3) are periodic, we can apply the K-band
period-luminosity relation for
semiregular variables established by Knapp et al. (2003). The
NSVS light curves suggest that their periods could be 240 and 320 days,
respectively. Then, with the P-MK relation
MK = -1.34 log P -4.5, and assuming that
the (average) K magnitude is not too different from ![]() ,
we find
for #60, MK = -7.69, d = 7.6 kpc, a distance close to
the one in Table 3 (5.9 kpc). As for #78, we obtain
MK = -7.86, d = 14.7 kpc, and this distance is
40% larger than that found in Table 2 (10.5 kpc).
,
we find
for #60, MK = -7.69, d = 7.6 kpc, a distance close to
the one in Table 3 (5.9 kpc). As for #78, we obtain
MK = -7.86, d = 14.7 kpc, and this distance is
40% larger than that found in Table 2 (10.5 kpc).
| No. | l | b | EB-V |
|
|
d | X | Y | Z | D |
| 59 | 114.351 | -61.453 | 0.020 | 1.329 | -6.97 | 111.8 | -30.5 | 48.7 | -98.2 | 26.5 |
| 60 | 127.393 | -22.689 | 0.050 | 1.429 | -7.15 | 5.9 | -11.8 | 4.3 | -2.3 | 4.7 |
| 61 | 135.175 | -24.325 | 0.053 | 1.611 | -7.42 | 18.0 | -20.2 | 11.6 | -7.4 | 11.0 |
| 62 | 149.845 | -49.446 | 0.068 | 3.060 | -7.16 | 7.3 | -12.6 | 2.4 | -5.5 | 2.1 |
| 63 | 163.123 | -58.546 | 0.032 | 1.478 | -7.25 | 28.1 | -22.5 | 4.3 | -24.0 | 0.2 |
| 64 | 162.049 | -36.082 | 0.291 | 1.183 | -6.56 | 22.4 | -25.7 | 5.6 | -13.2 | 4.2 |
| 65 | 172.347 | -28.475 | 0.316 | 1.832 | -7.64 | 53.1 | -54.8 | 6.2 | -25.3 | 3.9 |
| 66 | 165.713 | -21.582 | 0.164 | 1.349 | -7.01 | 14.1 | -21.2 | 3.2 | -5.2 | 3.5 |
| 67 | 181.911 | -31.637 | 0.289 | 1.415 | -7.13 | 11.1 | -17.9 | -0.3 | -5.8 | -0.3 |
| 68 | 176.133 | -25.619 | 0.472 | 1.284 | -6.89 | 8.9 | -16.5 | 0.5 | -3.9 | 0.9 |
| 69 | 181.245 | -23.296 | 0.587 | 1.697 | -7.53 | 50.6 | -55.0 | -1.0 | -20.0 | -1.9 |
| 70 | 190.204 | -20.452 | 0.164 | 1.502 | -7.28 | 14.6 | -21.9 | -2.4 | -5.1 | -1.9 |
| 71 | 140.861 | +22.738 | 0.177 | 1.417 | -7.13 | 9.8 | -15.5 | 5.7 | 3.8 | 7.7 |
| 72 | 161.381 | +21.086 | 0.080 | 1.363 | -7.03 | 10.3 | -17.7 | 3.1 | 3.7 | 5.2 |
| 73 | 169.337 | +22.917 | 0.071 | 1.545 | -7.33 | 8.5 | -16.2 | 1.5 | 3.3 | 3.5 |
| 74 | 26.142 | +22.867 | 0.316 | 1.188 | -6.58 | 21.5 | 9.3 | 8.7 | 8.4 | 10.1 |
| 75 | 48.195 | +21.356 | 0.082 | 1.399 | -7.10 | 10.7 | -1.9 | 7.4 | 3.9 | 8.4 |
| 76 | 107.672 | +23.332 | 0.093 | 1.593 | -7.39 | 10.7 | -11.5 | 9.3 | 4.2 | 11.0 |
| 77 | 110.190 | +23.019 | 0.155 | 3.273 | -7.08 | 13.9 | -12.9 | 12.0 | 5.4 | 13.9 |
| 78 | 109.469 | +21.659 | 0.218 | 1.458 | -7.21 | 10.5 | -11.8 | 9.2 | 3.9 | 10.8 |
| 79 | 112.308 | +20.130 | 0.548 | 3.370 | -7.03 | 3.9 | -9.9 | 3.4 | 1.3 | 4.5 |
| 80 | 68.200 | -21.673 | 0.092 | 2.258 | -7.50 | 5.8 | -6.5 | 5.0 | -2.2 | 5.0 |
| 81 | 37.019 | -39.965 | 0.069 | 1.382 | -7.07 | 95.6 | 50.0 | 44.1 | -61.4 | 25.5 |
| 82 | 78.911 | -23.760 | 0.066 | 3.363 | -7.04 | 3.2 | -7.9 | 2.9 | -1.3 | 3.2 |
| 83 | 83.298 | -28.940 | 0.058 | 2.130 | -7.56 | 25.8 | -5.9 | 22.4 | -12.5 | 19.5 |
Galactocentric XYZ coordinates were calculated in the system of
Newberg et al. (2003), in which the Sun is at X = -8.5 kpc,
Y = 0, Z = 0; the Y-axis is positive towards
l = +90
![]() and the Z axis is positive to b = +90
and the Z axis is positive to b = +90
![]() .
Figure 5 displays the YZ and XZ plots of previously known C stars and
those of Table 1. In this system, the Sgr Stream as traced with the M-type giants
(Majewski et al. 2003) is approximatively given by the following equation
(Newberg et al. 2003):
.
Figure 5 displays the YZ and XZ plots of previously known C stars and
those of Table 1. In this system, the Sgr Stream as traced with the M-type giants
(Majewski et al. 2003) is approximatively given by the following equation
(Newberg et al. 2003):
There are two new stars that are especially distant,
#59 at ![]() 110 kpc and #81 at
110 kpc and #81 at ![]() 95 kpc. Figure 5 shows that
four carbon stars are now known in the region Z < -60 kpc and none are
known in the symetrical region Z > +60 kpc, although a large number
have been discovered closer to us and with
95 kpc. Figure 5 shows that
four carbon stars are now known in the region Z < -60 kpc and none are
known in the symetrical region Z > +60 kpc, although a large number
have been discovered closer to us and with
![]() kpc.
This asymmetry qualitatively supports the existence of an extended branch of
the Sgr Stream as in the model of Law et al. (2005, see Fig. 4 of Mauron et al. 2005).
The width of this branch along the X direction is
kpc.
This asymmetry qualitatively supports the existence of an extended branch of
the Sgr Stream as in the model of Law et al. (2005, see Fig. 4 of Mauron et al. 2005).
The width of this branch along the X direction is ![]() 90 kpc, which
is in fair agreement with the positions of our four C stars.
90 kpc, which
is in fair agreement with the positions of our four C stars.
We note however that, recently, the Sgr Stream has been mapped by analysing the data of Sloan survey (Belokurov et al. 2006; Fellhauer et al. 2006). The map puts strong constraints on the Stream geometry and is well explained within a model where there is no matter at Z < -60 kpc. It is then possible that our four C stars with high negative Z are part of another stream. It will be interesting in the future to see if any new distant star can be detected close to them. In both cases, the fact that cool carbon stars are found indicate that an intermediate-age population is present in this region of the halo.
By searching the 2MASS catalogue for rare cool carbon stars located out of the
Galactic plane (|b| > 20![]() ), we have found 23 new cases with
), we have found 23 new cases with
![]() magnitudes covering the
range
magnitudes covering the
range ![]() 6 to 13.3. Their colours and spectra are typical
of AGB stars, which is also supported by important variability
for those objects bright enough to be detected by the NSVS survey.
6 to 13.3. Their colours and spectra are typical
of AGB stars, which is also supported by important variability
for those objects bright enough to be detected by the NSVS survey.
We have discovered four cases of C stars with J - ![]() > 3 and located
well above the Galactic plane. After including those already published
in the literature, we could made a list of 12 objects with similar properties.
Previous works (Groenewegen et al. 1997) show that two of them are
deficient in oxygen and one has a very small wind expansion velocity. This
suggests that some (or all) members of this sample could be metal deficient as well.
Because they are closer to us than the Magellanic Clouds,
supplementary observations of these stars, especially their CO emission, could help
to better know AGB winds at low metallicity.
> 3 and located
well above the Galactic plane. After including those already published
in the literature, we could made a list of 12 objects with similar properties.
Previous works (Groenewegen et al. 1997) show that two of them are
deficient in oxygen and one has a very small wind expansion velocity. This
suggests that some (or all) members of this sample could be metal deficient as well.
Because they are closer to us than the Magellanic Clouds,
supplementary observations of these stars, especially their CO emission, could help
to better know AGB winds at low metallicity.
Distances were estimated by using the 2MASS J and ![]() data and
by assuming our objects to be similar to those of
the Sagittarius dwarf galaxy. It is found that two objects
are at remarkably large distances from the Sun (
data and
by assuming our objects to be similar to those of
the Sagittarius dwarf galaxy. It is found that two objects
are at remarkably large distances from the Sun (![]() 100 kpc). Their galactocentric
XYZ coordinates suggest that they might belong, together with two other
distant carbon stars previously found, to a distant loop
of the Sgr stream extending at large negative Z. Additional detections
of distant stars in this region of the halo should help to confirm this
conclusion.
100 kpc). Their galactocentric
XYZ coordinates suggest that they might belong, together with two other
distant carbon stars previously found, to a distant loop
of the Sgr stream extending at large negative Z. Additional detections
of distant stars in this region of the halo should help to confirm this
conclusion.
Acknowledgements
We would like to thank our referee, E. Lagadec, for useful comments. We thank also the staff of Observatoire de Haute-Provence, which is supported by the French Centre National de Recherche Scientifique. We acknowledge the use of the Two Micron All Sky Survey (2MASS), which is a joint project of the University of Massachusetts and the Infrared Processing and Analysis Centre/California Institute of Technology, funded by the National Aeronautics and Space Administration (NASA) and the National Science Foundation (NSF). This publication also makes use of the data from the Northern Sky Variability Survey (NSVS) created jointly by the Los Alamos National Laboratory and University of Michigan. The NSVS was funded by the Department of Energy, NASA and NSF. Finally, this work benefited from using the CDS database of Strasbourg (France).
![\begin{figure}
\par\includegraphics[angle=-90,width=7.3cm,clip]{8181f02.ps}\end{figure}](/articles/aa/full/2007/45/aa8181-07/img32.gif)
![\begin{figure}
\par\includegraphics[angle=-90,width=8.2cm,clip]{8181f05a.ps}\hsp...
...mm}
\includegraphics[angle=-90,width=8.2cm,clip]{8181f05b.ps}
\par\end{figure}](/articles/aa/full/2007/45/aa8181-07/img43.gif)