 |
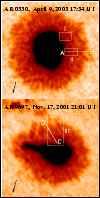
Figure 1:
Continuum intensity images from SOHO/MDI showing
the main sunspots belonging to active regions NOAA AR 0330 ( top)
and AR 9697 ( bottom). The field-of-view of both frames is about
|
| Open with DEXTER | |
In the text
 |
Figure 2:
Time sequence of continuum images ( left column) and the corresponding
magnetograms ( right column) in the field-of-view
(
|
| Open with DEXTER | |
In the text
 |
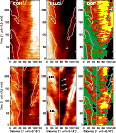
Figure 3:
Time slice maps taken from the continuum images ( left),
the corresponding magnetograms (middle) and Dopplergrams ( right),
respectively. For each map, the X-axis represents the distance
( |
| Open with DEXTER | |
In the text
 |
Figure 4:
Time sequence of images in the subfield marked by Window
II in Fig. 1 (
|
| Open with DEXTER | |
In the text
 |
Figure 5:
Same as the lower 3 frames in Fig. 3 but for the main spot of active
region NOAA AR 9697. The X-axis represents the distance ( |
| Open with DEXTER | |
In the text
 |
Figure 6:
Same as Fig. 4, but for the subfield contained within
Window III (
|
| Open with DEXTER | |
In the text