A&A 470, 1051-1057 (2007)
DOI: 10.1051/0004-6361:20077657
K. Uytterhoeven1 - E. Poretti1 - E. Rodríguez2 - P. De Cat3 - P. Mathias4 - J. H. Telting5 - V. Costa2 - A. Miglio6
1 - INAF-Osservatorio Astronomico di Brera,
via E. Bianchi 46, 23807 Merate
2 -
Instituto de Astrofísica de Andalucía (CSIC), Apartado 3004, 18080 Granada, Spain
3 -
Royal Observatory of Belgium, Ringlaan 3, 1180 Brussel, Belgium
4 -
Observatoire de la Côte d'Azur, GEMINI, CNRS, Université Nice
Sophia-Antipolis, BP 4229, 06304 Nice Cedex 4, France
5 -
Nordic Optical Telescope, Apartado 474, 38700 Santa Cruz de La Palma, Spain
6 -
Institut d'Astrophysique et de Géophysique de l'Université de Liège, Allée du 6 Août 17, 4000 Liège, Belgium
Received 17 April 2007 / Accepted 15 May 2007
Abstract
Aims. We obtained the first long, homogenous time-series of V2104 Cyg, consisting of 679 datapoints, with the ![]() photometers of the Sierra Nevada and San Pedro Mártir Observatories. Our aim was to detect and subsequently interpret the intrinsic frequencies of this previously unstudied variable star, which turned out to be a Be star. We evaluate its place among the variable B stars on the upper Main Sequence. To obtain additional information on physical parameters we collected a few spectra with the Elodie and FIES instruments.
photometers of the Sierra Nevada and San Pedro Mártir Observatories. Our aim was to detect and subsequently interpret the intrinsic frequencies of this previously unstudied variable star, which turned out to be a Be star. We evaluate its place among the variable B stars on the upper Main Sequence. To obtain additional information on physical parameters we collected a few spectra with the Elodie and FIES instruments.
Methods. We searched for frequencies in the uvby passbands using 2 different frequency analysis methods and used the S/N>4 criterion to select the significant periodicities. We obtained an estimate of the physical parameters of the underlying B star of spectral type between B5 and B7, by correcting for the presence of a circumstellar disk using a formalism based on the strength of the H![]() line emission.
line emission.
Results. We detected 3 independent frequencies with amplitudes below 0.01 mag, ![]() = 4.7126 d-1 ,
= 4.7126 d-1 ,
![]() = 2.2342 d-1 and
= 2.2342 d-1 and ![]() = 4.671 d-1 , and discovered that V2104 Cyg is a Be star. The fast rotation (
= 4.671 d-1 , and discovered that V2104 Cyg is a Be star. The fast rotation (
![]() km s-1, and 27
km s-1, and 27![]() <i< 45
<i< 45![]() )
hampered the investigation of the associated pulsational parameters
)
hampered the investigation of the associated pulsational parameters ![]() .
.
Conclusions. The most plausible explanation for the observed variability of this mid-late type Be star is a non-radial pulsation model.
Key words: stars: oscillations - stars: emission-line, Be - stars: individual: V2104 Cyg
Several pulsators and variable stars of spectral type B occupy the
region of the upper Main Sequence. Among them are the ![]() Cephei
stars, the Slowly Pulsating B stars (SPBs) and the Be stars.
The two former classes are well-established pulsators that show
multiperiodic line-profile and light variations and whose pulsations
are driven by the
Cephei
stars, the Slowly Pulsating B stars (SPBs) and the Be stars.
The two former classes are well-established pulsators that show
multiperiodic line-profile and light variations and whose pulsations
are driven by the ![]() -mechanism acting on the iron
bump. Most
-mechanism acting on the iron
bump. Most ![]() Cephei stars (spectral type B0.5-B3) pulsate in
low-order p- and g-modes with typical pulsation periods between
0.3 and 0.8 days. The largest fraction of this pulsational class is composed of
moderate rotators (
Cephei stars (spectral type B0.5-B3) pulsate in
low-order p- and g-modes with typical pulsation periods between
0.3 and 0.8 days. The largest fraction of this pulsational class is composed of
moderate rotators (
![]() km s-1). The SPBs are less massive B stars (spectral type
B2-B9) and slow rotators that pulsate in high radial order
g-mode of low spherical harmonic degree
km s-1). The SPBs are less massive B stars (spectral type
B2-B9) and slow rotators that pulsate in high radial order
g-mode of low spherical harmonic degree ![]() with typical pulsation
periods of 0.5 to 5 days. We refer to Stankov & Handler (2005) and De
Cat (2002) for overviews of the properties of the
with typical pulsation
periods of 0.5 to 5 days. We refer to Stankov & Handler (2005) and De
Cat (2002) for overviews of the properties of the ![]() Cephei stars and SPBs, respectively.
Cephei stars and SPBs, respectively.
The Be stars are a more complex and less well understood class of
near Main Sequence rapidly rotating B stars that produce a disk in their
equatorial plane and hence show Balmer line emission. Be stars
exhibit variations on different time-scales (hours-years), with a
broad range of amplitudes. Explanations for this variability have been
sought among the dynamics of the circumstellar disk, stellar wind,
rotational modulation, magnetic field and/or pulsations (e.g. Porter
& Rivinius 2003). The highest fraction of Be stars is found
in early-B type stars (B1-B2), while observed cases in the
spectral type interval of B7-A2 are less frequent (Zorec 2000).
However recently, a number of late-type Be stars were discovered during the ground-based preparatory work of the
CoRoTsatellite (Neiner et al. 2005). The emission line B
stars occupy the instability strips of ![]() Cephei and SPB
pulsators and an obvious question arises whether or not the observed
short-period Be variations resemble the properties of these
well-established pulsators.
Cephei and SPB
pulsators and an obvious question arises whether or not the observed
short-period Be variations resemble the properties of these
well-established pulsators.
The short-periods observed in Be stars typically range from 0.2 to 5
days. Ground-based light curves mainly reveal
monoperiodic signals, with periods close to the rotational
period (the so-called ![]() Eri variables, Balona 1990), and
amplitudes of a few tens of mmag. These targets also show
line-profile variations (LPV) of low spherical harmonic degree, similar
to the LPV observed in
Eri variables, Balona 1990), and
amplitudes of a few tens of mmag. These targets also show
line-profile variations (LPV) of low spherical harmonic degree, similar
to the LPV observed in ![]() Cephei variables, although the latter
have shorter periods. The variability has been attributed to
rotational modulation by Balona (1990, 1995) or non-radial pulsations
(NRP) (Baade 1982). Spectroscopically, nearly all Be stars of early-B
type show LPV (e.g. Rivinius et al. 2003). Contrary to ground-based
photometric data, the LPV of several early-type Be stars reveal multiperiodic
signals. The observed variability is interpreted in terms of NRP
g-modes, typically with
Cephei variables, although the latter
have shorter periods. The variability has been attributed to
rotational modulation by Balona (1990, 1995) or non-radial pulsations
(NRP) (Baade 1982). Spectroscopically, nearly all Be stars of early-B
type show LPV (e.g. Rivinius et al. 2003). Contrary to ground-based
photometric data, the LPV of several early-type Be stars reveal multiperiodic
signals. The observed variability is interpreted in terms of NRP
g-modes, typically with ![]() .
Given the g-mode nature and
the similar length of the pulsation periods, these Be stars appear to
resemble the pulsational behaviour of SPBs. Until now, no clear cases
of LPV in late-Be type stars (later than B6) have been found (Baade
1989; Rivinius et al. 2003). Recently, proof of the presence of
low-amplitude additional periods and variability of late-type Be stars
has been given by the MOST satellite as multiperiodic signals
have been detected in the light of the Be stars HD163868 (B5Ve, Walker
et al. 2005) and
.
Given the g-mode nature and
the similar length of the pulsation periods, these Be stars appear to
resemble the pulsational behaviour of SPBs. Until now, no clear cases
of LPV in late-Be type stars (later than B6) have been found (Baade
1989; Rivinius et al. 2003). Recently, proof of the presence of
low-amplitude additional periods and variability of late-type Be stars
has been given by the MOST satellite as multiperiodic signals
have been detected in the light of the Be stars HD163868 (B5Ve, Walker
et al. 2005) and ![]() CMi (B8Ve, Saio et al. 2007). This result is
very encouraging and gives high expectations for the outcome of the Be
programme stars of the space mission CoRoT, which was launched
on December 27 2006.
CMi (B8Ve, Saio et al. 2007). This result is
very encouraging and gives high expectations for the outcome of the Be
programme stars of the space mission CoRoT, which was launched
on December 27 2006.
V2104 Cyg (HD190397, HIP98611,
![]() ,
,
![]() ,
V=7.65 mag) is listed in the HIPPARCOS catalogue (Perryman et al. 1997) as an unsolved variable of spectral type A0, probably a
pulsating star, located at a distance of approximately
,
V=7.65 mag) is listed in the HIPPARCOS catalogue (Perryman et al. 1997) as an unsolved variable of spectral type A0, probably a
pulsating star, located at a distance of approximately
![]() pc. According to Grenier et al. (1999), the spectrum of V2104 Cyg
resembles a B8 Main Sequence star. Such a late-type B star or
early-type A star would be a challenging object for many variable
classes. To clarify this vague characterisation we obtained
a photometric time-series and a few spectra. From the spectra it soon
became evident that V2104 Cyg shows Balmer line emission (see
Sect. 4). The study of V2104 Cyg is particularly
interesting as (multiperiodic) variability is scarcely detected in
late-type Be stars (see above). We present an analysis of the variable
character of this newly discovered Be star and try to identify its
place among the variable B stars on the upper Main Sequence.
pc. According to Grenier et al. (1999), the spectrum of V2104 Cyg
resembles a B8 Main Sequence star. Such a late-type B star or
early-type A star would be a challenging object for many variable
classes. To clarify this vague characterisation we obtained
a photometric time-series and a few spectra. From the spectra it soon
became evident that V2104 Cyg shows Balmer line emission (see
Sect. 4). The study of V2104 Cyg is particularly
interesting as (multiperiodic) variability is scarcely detected in
late-type Be stars (see above). We present an analysis of the variable
character of this newly discovered Be star and try to identify its
place among the variable B stars on the upper Main Sequence.
V2104 Cyg was observed in the framework of a double-site campaign in
the autumn of 2005. Two twin Danish six-channel uvby ![]() photometers were used, one at the Sierra Nevada Observatory (SNO),
Spain, and the other at the San
Pedro Mártir Observatory (SPMO), Mexico, attached to the 90 cm and
1.5 m telescopes, respectively. Both photometers are equipped for
simultaneous measurements in uvby or the narrow and wide
H
photometers were used, one at the Sierra Nevada Observatory (SNO),
Spain, and the other at the San
Pedro Mártir Observatory (SPMO), Mexico, attached to the 90 cm and
1.5 m telescopes, respectively. Both photometers are equipped for
simultaneous measurements in uvby or the narrow and wide
H![]() channels (Nielsen 1983). Nevertheless, most of the data were
collected in the four uvby filters in order to investigate the
variability behaviour of this star. Only a few points were obtained in
H
channels (Nielsen 1983). Nevertheless, most of the data were
collected in the four uvby filters in order to investigate the
variability behaviour of this star. Only a few points were obtained in
H![]() at SNO for calibration purposes of the photometric indices.
at SNO for calibration purposes of the photometric indices.
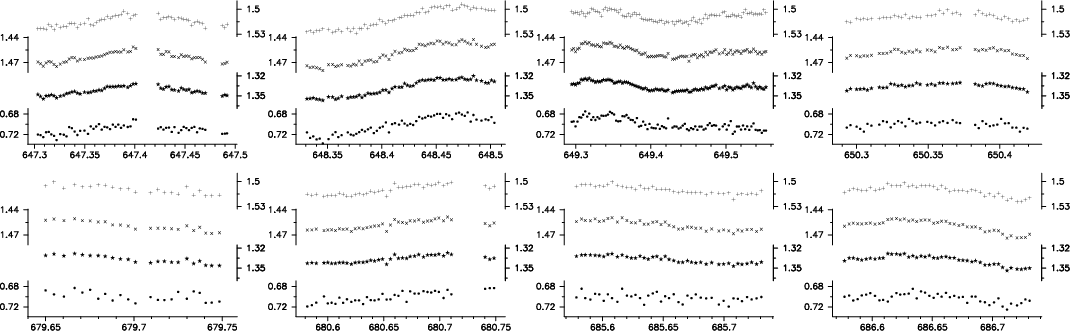
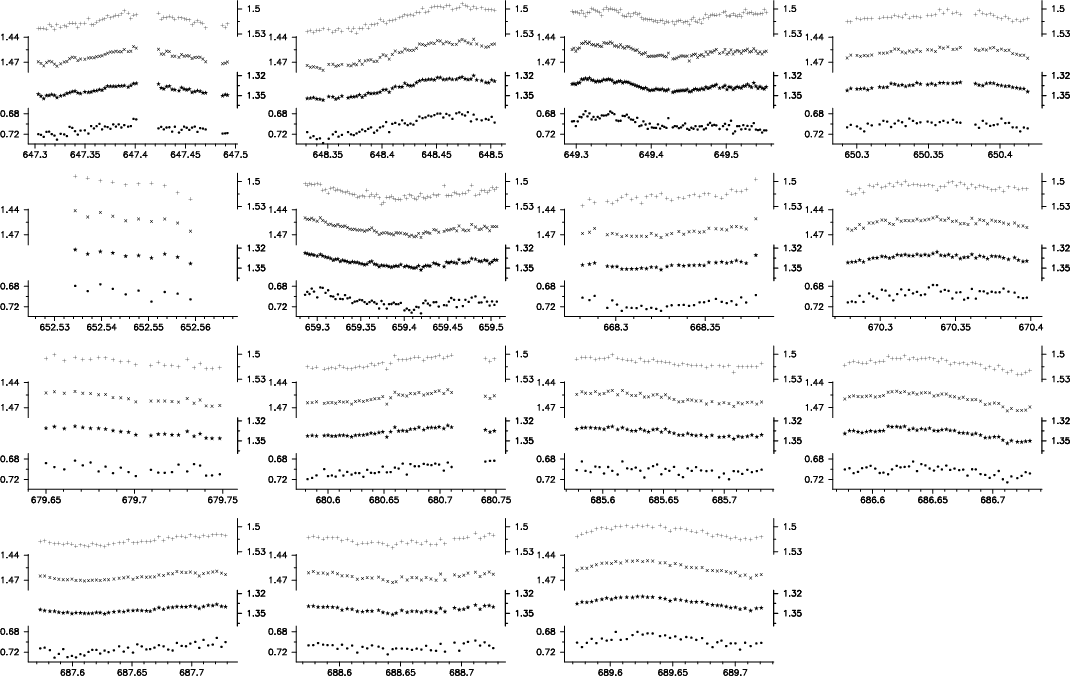
HR 7634 (V=6.16 mag, A4Vn) and HR 7692 (V=6.19 mag, F4V) were used as comparison stars in both sites. A total of 414 uvbydatapoints of V2104 Cyg were collected on 8 nights at SNO, from October 3 to 26, and 265 uvby datapoints on 7 nights at SPMO, from November 4 to 14. In total, about 54 h of useful data were acquired. The light curves are given in Fig. 1.
The quality of the nights was excellent at SPMO. Bouguer's lines, i.e. the least-squares fit to the observations of a same star versus airmass for each night, yielded correlation coefficients in the interval 0.994-1.000, whereby 23 times out of 28 in the 0.998-1.000 interval. Mean extinction coefficients were 0.472 mag in u light, 0.267 mag in v light, 0.165 mag in b light and 0.116 mag in y light. Similar mean coefficients, with standard deviation given between brackets, were obtained at SNO: 0.484 mag (0.013 mag), 0.278 mag (0.009 mag), 0.171 mag (0.007 mag) and 0.121 mag (0.010 mag) for filters u, v, b and y, respectively, with the airmass ranging from about 1.05 to 1.5 each observing night.
An analysis of the magnitude differences between the two comparison stars was carried out to get an additional feeling of the quality of the dataset. The overall standard deviations of the 268 magnitude differences obtained at SPMO are: 6.7 mmag in u light, 2.0 mmag in v light, 1.9 mmag in b light and 1.8 mmag in y light. The high scatter in the u filter is due to some leakage problems in the photomultiplier which affected the measurements in a random way. The standard deviations of each night lie between 4.6-7.5, 1.4-2.3, 1.4-2.2 and 1.2-2.1 mmag in u, v, b and y filters, respectively.
For the SNO data, we measured the two comparison stars 427 times and the magnitude differences yielded standard deviations of 6.3, 2.3, 2.3 and 2.9 mmag in u, v, b and y filters, respectively. Excluding the night JD 2 4453 652 (where values are 1.5-2.0 times greater), the standard deviations of each night lie between 5.5-6.7, 1.7-2.6, 1.4-2.3 and 2.1-2.7 mmag in u, v, b and y filters, respectively.
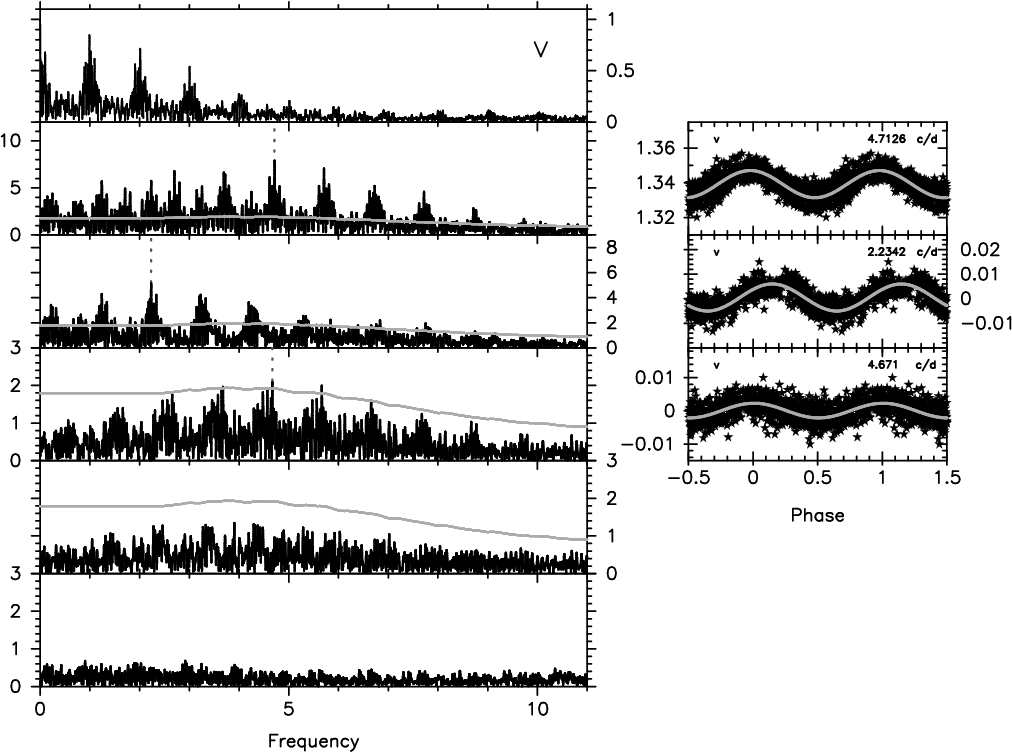
Since small differences are present in the mean values measured at SNO an SPMO, the magnitude differences between the comparison stars have been aligned. The combined timeseries have standard deviations of 6.4, 2.2, 2.1 and 2.3 mmag in uvby, respectively. Therefore, our photometric timeseries are characterised by very good precision, close to the best value we can obtain from the ground. The corresponding periodogram is shown in the bottom panel of Fig. 2.
The frequency search was carried out using Lomb-SCARGLE (Scargle 1982) as well as the least-squares power spectrum method (Vanícek 1971). The latter method allows the detection of the constituents of the light curve one by one, whereby only the values of the detected frequencies are introduced as known constituents in each new search. This procedure differs from the SCARGLE method as it does not require any data prewhitening as amplitudes and phases of the known constituents are recalculated for each new trial frequency, whereby the exact amount of signal for any detected term is always subtracted.
We first double-checked the reliability of the
comparison stars. The frequency analysis of the combined
timeseries between the two comparison stars did not reveal any
significant term. White noise is around 0.3 mmag in the vby
data and amplitudes of the highest peaks are in the 0.6-0.8 mmag
interval. The u data show a more noisy behaviour. The highest
peaks occur at different frequencies in the different filters,
suggesting a random enhancement. As an illustration, we show the
frequency spectrum of the v data in the bottom panel of
Fig. 2. Thus, we can state that the two comparison
stars are constant at the level of a few 0.1 mmag.
The frequency analysis of the V2104 Cyg timeseries
turned out to be more complex. We initially analysed the SNO and SPMO
datasets separately.
We searched for frequencies in the interval 0.01-25.0 d-1 with a
frequency step of 0.01 d-1. We detected similar structures in the
least-squares power spectra and the SCARGLE periodograms of the
datasets in the different filters and found evidence for two
frequencies centered at ![]() = 4.71 d-1 and
= 4.71 d-1 and
![]() = 2.23 d-1, or their one-day
aliases. Additional frequency peaks were visible but were below the significance threshold (see below).
= 2.23 d-1, or their one-day
aliases. Additional frequency peaks were visible but were below the significance threshold (see below).
Subsequently, a preliminary solution for each dataset was obtained by means of these two frequencies only and the two datasets were re-aligned at the same mean brightness level. In particular, we obtained the same mean magnitude for the y data, within error bars, while small misalignements were measured in the other data.
In a second step we analysed the aligned full dataset, consisting of
679 datapoints and spanning 42 days. Given the improved frequency
resolution we adopted a frequency step of 0.001 d-1. The spectral
window of our timeseries is shown in the upper panel of
Fig. 2. Besides ![]() = 4.713 d-1 and
= 4.713 d-1 and
![]() = 2.234 d-1,
with amplitudes of 7.6 and 5.7 mmag in the v filter
respectively, we also found in all filters and using both frequency
methods, a third term
= 2.234 d-1,
with amplitudes of 7.6 and 5.7 mmag in the v filter
respectively, we also found in all filters and using both frequency
methods, a third term ![]() = 4.670 d-1, with an amplitude of
2.4 mmag in the v time series. The amplitudes of all 3
frequencies satisfy the S/N>3.6 significance criterion and also the
more severe S/N>4 criterion (Breger et al. 1993; Kuschnig et al. 1997; De Cat & Cuypers 2003) in the vby filters. However,
the low-amplitude of
= 4.670 d-1, with an amplitude of
2.4 mmag in the v time series. The amplitudes of all 3
frequencies satisfy the S/N>3.6 significance criterion and also the
more severe S/N>4 criterion (Breger et al. 1993; Kuschnig et al. 1997; De Cat & Cuypers 2003) in the vby filters. However,
the low-amplitude of ![]() does not pass S/N>4 in the noisy u
filter (see last row Table 1). The S/N-level was
computed as the average amplitude over a frequency interval with a
width of 5 d-1 in an oversampled SCARGLE periodogram obtained after
final prewhitening. We note that the S/N-level is a factor 1.5 higher
than the white noise detected in the comparison stars (bottom panel
Fig. 2). Comparing the white noise with the
residual time-series of V2104 Cyg (last but one bottom panel
Fig. 2), there might be even more frequencies
present in the signal of V2104 Cyg, with amplitudes currently below
the significance threshold.
does not pass S/N>4 in the noisy u
filter (see last row Table 1). The S/N-level was
computed as the average amplitude over a frequency interval with a
width of 5 d-1 in an oversampled SCARGLE periodogram obtained after
final prewhitening. We note that the S/N-level is a factor 1.5 higher
than the white noise detected in the comparison stars (bottom panel
Fig. 2). Comparing the white noise with the
residual time-series of V2104 Cyg (last but one bottom panel
Fig. 2), there might be even more frequencies
present in the signal of V2104 Cyg, with amplitudes currently below
the significance threshold.
For the moment we accept a model with ![]() ,
,
![]() and
and ![]() .
We did not find a direct relation between the three
frequencies, which can be considered independent of each other. To
optimise this triperiodic model we used a code, kindly made available
by Dr. Jan Cuypers (Royal Observatory of Belgium), that searches
simultaneously a set of frequencies around the input values to find
the multiperiodic combination that fits the data best. The optimised
solution is:
.
We did not find a direct relation between the three
frequencies, which can be considered independent of each other. To
optimise this triperiodic model we used a code, kindly made available
by Dr. Jan Cuypers (Royal Observatory of Belgium), that searches
simultaneously a set of frequencies around the input values to find
the multiperiodic combination that fits the data best. The optimised
solution is: ![]()
![]() d-1,
d-1,
![]()
![]() d-1 and
d-1 and ![]()
![]() d-1. A similar fit using a
different code (MTRAP, Carpino et al. 1987) yielded coincident
results. The given accuracy of the frequencies is the average of the
estimated accuracies in the uvby filters. The frequency accuracy
in a particular filter x is calculated as
d-1. A similar fit using a
different code (MTRAP, Carpino et al. 1987) yielded coincident
results. The given accuracy of the frequencies is the average of the
estimated accuracies in the uvby filters. The frequency accuracy
in a particular filter x is calculated as
![]() (Montgomery &
O'Donoghue 1999), with
(Montgomery &
O'Donoghue 1999), with
![]() the standard deviation
of the final residuals,
the standard deviation
of the final residuals, ![]() the amplitude of the frequency
the amplitude of the frequency
![]() in filter x and
in filter x and ![]() the total timespan of the
observations. The solution of the least-squares fit of this
triperiodic model is given in Table 1. The phases
the total timespan of the
observations. The solution of the least-squares fit of this
triperiodic model is given in Table 1. The phases
![]() are calculated according to the formula
are calculated according to the formula
![]() .
Note that the phase values for
.
Note that the phase values for
![]() in the four passbands are in excellent agreement, supporting the
reality of this small amplitude term. The triperiodic fit applied to
the individual datasets of SNO and SPMO yielded the same mean
brightness levels in all filters, i.e. the alignment procedure was
insensitive to
in the four passbands are in excellent agreement, supporting the
reality of this small amplitude term. The triperiodic fit applied to
the individual datasets of SNO and SPMO yielded the same mean
brightness levels in all filters, i.e. the alignment procedure was
insensitive to ![]() .
The SCARGLE periodogram of the v filter at
different stages of the frequency search and the phase diagrams with
the 3 frequencies are given in Fig. 2. For reasons
of visibility of the peaks around
.
The SCARGLE periodogram of the v filter at
different stages of the frequency search and the phase diagrams with
the 3 frequencies are given in Fig. 2. For reasons
of visibility of the peaks around ![]() we only show the
(S/N>3.6)-level, indicated by the light grey horizontal line.
we only show the
(S/N>3.6)-level, indicated by the light grey horizontal line.
| u light | v light | b light | y light | |||||||||||
| Term | Freq. | Ampl. | Phase | Ampl. | Phase | Ampl. | Phase | Ampl. | Phase | |||||
| [d-1] | [mag] | [rad] | [mag] | [rad] | [mag] | [rad] | [mag] | [rad] | ||||||
|
|
4.7126 | 0.0086 | 0.17 | 0.0073 | 0.26 | 0.0071 | 0.25 | 0.0071 | 0.27 | |||||
|
2.2342 | 0.0098 | 5.41 | 0.0059 | 5.31 | 0.0058 | 5.28 | 0.0051 | 5.28 | |||||
|
4.671 | 0.0026 | 6.2 | 0.0024 | 6.1 | 0.0024 | 6.1 | 0.0024 | 6.2 | |||||
|
Mean |
|
|
|
|
||||||||||
| Residual rms [mag] | 0.0065 | 0.0025 | 0.0026 | 0.0028 | ||||||||||
|
S/N=4 @ |
0.0038 | 0.0022 | 0.0022 | 0.0019 | ||||||||||
We also analysed the HIPPARCOS data in search for traces of intrinsic variability. The resulting SCARGLE periodogram resembled very much the window function and no frequencies could be detected. The poor spectral window and the poorer accuracy of the HIPPARCOS data did not allow detection of any of our three small amplitude terms.
In addition to the photometric time-series we obtained 3 spectra
during 3 consecutive nights in June 2006 with the Elodie
spectrograph (
![]() )
at the 193 cm telescope of the
Observatoire de Haute Provence (OHP), France, and one spectrum in
November 2006 with the FIES spectrograph in medium resolution
mode (
)
at the 193 cm telescope of the
Observatoire de Haute Provence (OHP), France, and one spectrum in
November 2006 with the FIES spectrograph in medium resolution
mode (
![]() )
at the Nordic Optical Telescope located at the
Observatorio del Roque de los Muchachos, La Palma, Spain. We combined
the 3 Elodie spectra, after checking that there are no
clear differences visible, resulting in an average
spectrum with a signal-to-noise ratio of 70. The signal-to-noise ratio
of the FIES spectrum is about 150.
)
at the Nordic Optical Telescope located at the
Observatorio del Roque de los Muchachos, La Palma, Spain. We combined
the 3 Elodie spectra, after checking that there are no
clear differences visible, resulting in an average
spectrum with a signal-to-noise ratio of 70. The signal-to-noise ratio
of the FIES spectrum is about 150.
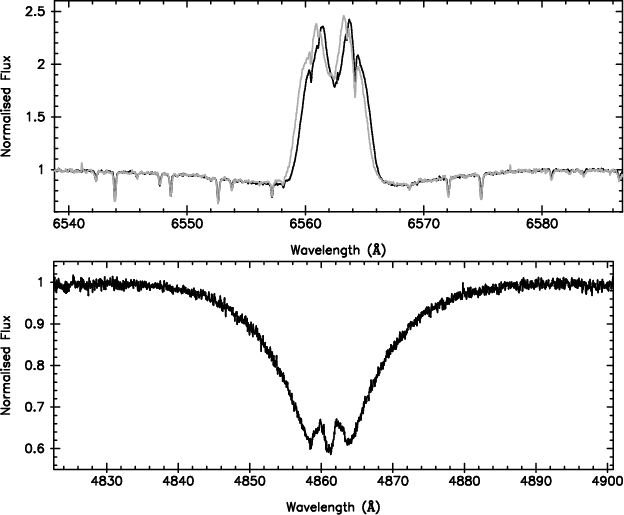
The H![]() and H
and H![]() line profiles clearly show a double-peaked
emission line (see Fig. 3). Hence, we identify V2104 Cyg
as a Be star. The emission effect appears to be much stronger in
H
line profiles clearly show a double-peaked
emission line (see Fig. 3). Hence, we identify V2104 Cyg
as a Be star. The emission effect appears to be much stronger in
H![]() than in H
than in H![]() .
In the FIES spectra we also see a suggestion
of emission in the absorption profile of H
.
In the FIES spectra we also see a suggestion
of emission in the absorption profile of H![]() but this needs to
be confirmed. A comparison between the H
but this needs to
be confirmed. A comparison between the H![]() profile (upper panel
Fig. 3) - obtained in June 2006 (Elodie spectra,
grey) and in November 2006 (FIES spectrum, black) - shows a radial
velocity shift and small variations in the shape of the emission peaks. A
dedicated spectroscopical campaign is necessary to study the
dynamical character of the circumstellar disk.
profile (upper panel
Fig. 3) - obtained in June 2006 (Elodie spectra,
grey) and in November 2006 (FIES spectrum, black) - shows a radial
velocity shift and small variations in the shape of the emission peaks. A
dedicated spectroscopical campaign is necessary to study the
dynamical character of the circumstellar disk.
As the line profiles are strongly rotationally broadened, only the
Balmer lines, He I lines and the absorption line of Mg II 4481 Å
are prominently present and not lost in the noise of the spectra. To
derive an estimate of ![]() we calculated theoretical line
profiles for a rotating star by means of the code described by
Schrijvers & Telting (1999), whereby we assumed a neglegible
contribution to the line shape from NRP. We used limb-darkening
coefficient
we calculated theoretical line
profiles for a rotating star by means of the code described by
Schrijvers & Telting (1999), whereby we assumed a neglegible
contribution to the line shape from NRP. We used limb-darkening
coefficient
![]() ,
taken from Díaz-Cordovés et al. (1995) for the physical parameters given in Table 2. As
Collins et al. (1991) have suggested the He I 4027 Å, He I 4471 Å and
Mg II 4481 Å profiles as most suitable candidates for the
determination of
,
taken from Díaz-Cordovés et al. (1995) for the physical parameters given in Table 2. As
Collins et al. (1991) have suggested the He I 4027 Å, He I 4471 Å and
Mg II 4481 Å profiles as most suitable candidates for the
determination of ![]() ,
we focussed on these line profiles only.
From the best fits of the observed profiles we estimated
,
we focussed on these line profiles only.
From the best fits of the observed profiles we estimated
![]() km s-1, with formal errors of 10 km s-1.
km s-1, with formal errors of 10 km s-1.
We calculated the EW of the H![]() profile and obtained
profile and obtained
![]() Å. The red peak of the emission is higher than
the violet peak with peak intensities of R=2.42 and V=2.36.
The peak
separation
Å. The red peak of the emission is higher than
the violet peak with peak intensities of R=2.42 and V=2.36.
The peak
separation ![]() between the red and violet peak is about 105 km s-1. As
between the red and violet peak is about 105 km s-1. As ![]() is a measure of the radius of the circumstellar
disk, namely (2
is a measure of the radius of the circumstellar
disk, namely (2
![]() assuming a Keplerian rotation (e.g. Zamarov et al. 2001), we
estimate the radius of the circumstellar disk to be about 34 times
the stellar radius.
assuming a Keplerian rotation (e.g. Zamarov et al. 2001), we
estimate the radius of the circumstellar disk to be about 34 times
the stellar radius.
Given the double-peaked nature of the emission line, with small
side-lobes on each side (Fig. 3), we expect to see the
circumstellar disk under an inclination angle i between
![]() and
and ![]() 20
20
![]() (e.g. Hanuschik et al. 1996).
(e.g. Hanuschik et al. 1996).
We compared the FIES spectrum of V2104 Cyg with a set of spectra from the noao spectral library (Valdes et al. 2004) and deduced a spectral type between B5 and B7. Hence we obtained a hotter star than previously reported (A0, Perryman et al. 1997; B8, Grenier et al. 1999). The misclassification of a late-B type star as an early-A type star is not uncommon among fast rotators. Being a mid-late Be star, V2104 Cyg remains an interesting target given that cooler Be stars are less frequently observed than early-type Be stars.
First, we calculated
![]() ,
,
![]() and MV of V2104 Cyg
from the Strömgren indices, whereby using HR 7634 and HR 7692 as
calibration stars. The observed Strömgren indices (all expressed in
mag throughout the text) are
(b-y)=0.000, m1=0.096 and
c1=0.534. They have been calculated from the mean magnitude
differences reported in Table 1 and from uvby
standard photometry of HR 7634. A
and MV of V2104 Cyg
from the Strömgren indices, whereby using HR 7634 and HR 7692 as
calibration stars. The observed Strömgren indices (all expressed in
mag throughout the text) are
(b-y)=0.000, m1=0.096 and
c1=0.534. They have been calculated from the mean magnitude
differences reported in Table 1 and from uvby
standard photometry of HR 7634. A
![]() value simulaneous to
uvby photometry was determined from dedicated observations at
SNO. We obtained dereddened values starting from the above indices
and applying the T EMPL OGG method (Kupka & Bruntt 2001):
(b-y)0=-0.057, m0=0.115, c0=0.523. The interstellar reddening
is non-negligible,
Eb-y=+0.057 mag, since the star lies only
14
value simulaneous to
uvby photometry was determined from dedicated observations at
SNO. We obtained dereddened values starting from the above indices
and applying the T EMPL OGG method (Kupka & Bruntt 2001):
(b-y)0=-0.057, m0=0.115, c0=0.523. The interstellar reddening
is non-negligible,
Eb-y=+0.057 mag, since the star lies only
14![]() above the galactic plane. Additionally, the T EMPL OGG
method allowed us to derive MV=-1.44 mag,
above the galactic plane. Additionally, the T EMPL OGG
method allowed us to derive MV=-1.44 mag,
![]() and
and
![]() K. According to these values, V2104 Cyg is located far
above the instability strip of the SPBs in the Hertzsprung-Russell
diagram (black square in Fig. 4).
K. According to these values, V2104 Cyg is located far
above the instability strip of the SPBs in the Hertzsprung-Russell
diagram (black square in Fig. 4).
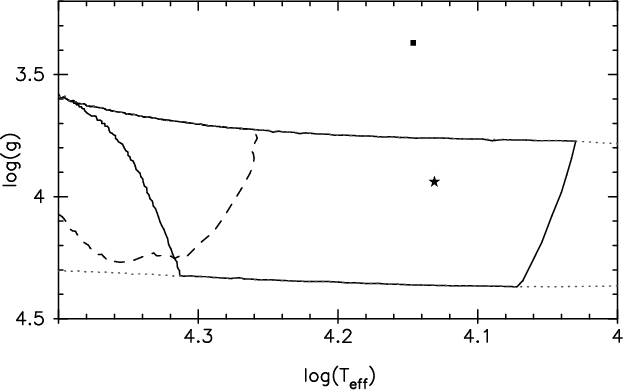 |
Figure 4:
Possible position of V2104 Cyg in the Hertzsprung-Russell diagram. The black square
indicates the position derived from the observed photometric indices while
the star indicates the position after correction for the contribution of the
stellar disk. The full
black lines and the dashed black lines represent the instability strips for
the SPB and |
As we are dealing with a Be star, we expect that the presence of the
circumstellar envelope affects the observed photometric indices. This
might also explain why SIMBAD reports scattered values (2.610,
2.648 and 2.705) of the ![]() index for our target. To deduce the
indices from the underlying B star we calculated the transformation
formulae given by Fabregat & Reglero (1990), which are based on the
assumption that the contribution of the circumstellar disk is
proportional to the EW of the H
index for our target. To deduce the
indices from the underlying B star we calculated the transformation
formulae given by Fabregat & Reglero (1990), which are based on the
assumption that the contribution of the circumstellar disk is
proportional to the EW of the H![]() emission peak. Assuming an EWof H
emission peak. Assuming an EWof H![]() of
of
![]() Å we obtained the following new values
of the Strömgren indices:
Å we obtained the following new values
of the Strömgren indices:
![]() ,
,
![]() ,
,
![]() and
and
![]() .
Applying the T EMPL OGG method on
these values resulted in dereddened values
.
Applying the T EMPL OGG method on
these values resulted in dereddened values
![]() ,
,
![]() and
and
![]() in addition to
in addition to
![]() mag,
mag,
![]() and
and
![]() K. After correction for the contribution of
the circumstellar disk, the position of the underlying B star falls
nicely inside the SPB instability strip (
K. After correction for the contribution of
the circumstellar disk, the position of the underlying B star falls
nicely inside the SPB instability strip (![]() in Fig. 4).
in Fig. 4).
From the corrected value
![]() mag we can estimate the
luminosity and the mass of V2104 Cyg using the relation for Main
Sequence stars between absolute magnitude and luminosity and the
mass-luminosity relation. Assuming that V2104 Cyg is a MS star we
find:
mag we can estimate the
luminosity and the mass of V2104 Cyg using the relation for Main
Sequence stars between absolute magnitude and luminosity and the
mass-luminosity relation. Assuming that V2104 Cyg is a MS star we
find:
![]() and
and
![]() .
Using the
formula
.
Using the
formula
![]() ,
we estimate
,
we estimate
![]() .
The value of the mass is compatible with the expected values for
a B5-B7 star according to the tabulation of Harmanec (1988), while we
obtained a slightly lower radius (2.1 versus 3.0
.
The value of the mass is compatible with the expected values for
a B5-B7 star according to the tabulation of Harmanec (1988), while we
obtained a slightly lower radius (2.1 versus 3.0 ![]() ). From
these estimates of mass and radius, the expected upper limit of the
inclination i<45
). From
these estimates of mass and radius, the expected upper limit of the
inclination i<45![]() (see above), and with
(see above), and with
![]() km s-1,
we can derive that V2104 Cyg rotates at least at 65% of its
critical velocity, using
km s-1,
we can derive that V2104 Cyg rotates at least at 65% of its
critical velocity, using
![]() .
This fact confirms the tight connection
between fast rotation and the Be phenomenon. Moreover, an
interpretation in terms of multiperiodic pulsations would confirm and
strengthen the relation between pulsation and mass loss, and
demonstrate that this relation also exists in mid-late Be stars.
Subsequently, we obtain from the derived
.
This fact confirms the tight connection
between fast rotation and the Be phenomenon. Moreover, an
interpretation in terms of multiperiodic pulsations would confirm and
strengthen the relation between pulsation and mass loss, and
demonstrate that this relation also exists in mid-late Be stars.
Subsequently, we obtain from the derived ![]() interval and imposing
interval and imposing
![]() a lower limit for the inclination angle:
i>27
a lower limit for the inclination angle:
i>27![]() .
.
Next, from
![]() km s-1, a stellar radius in the
interval [2,3]
km s-1, a stellar radius in the
interval [2,3] ![]() ,
and an inclination angle between 27
,
and an inclination angle between 27![]() and 45
and 45![]() we arrive at a (very) rough estimate of the rotational
frequency:
we arrive at a (very) rough estimate of the rotational
frequency:
![]() d-1. We note that the observed
intrinsic frequencies
d-1. We note that the observed
intrinsic frequencies ![]() and
and ![]() lie in this interval.
It is not uncommon for Be stars that
the rotational period is dominantly present in the light variations
(e.g. Balona 1990). This possibility is further discussed in
Sect. 6.
lie in this interval.
It is not uncommon for Be stars that
the rotational period is dominantly present in the light variations
(e.g. Balona 1990). This possibility is further discussed in
Sect. 6.
We stress that the derived physical parameters tabulated in
Table 2 are only a first estimate as the contribution
and properties of the circumstellar disk are still unknown and as the
properties derived from the low S/N noise spectra have to be taken
with caution.
|
|
Mass | Radius |
|
||
|
|
|
In the light curves of V2104 Cyg, we detected 3 intrinsic frequencies
with amplitudes below 0.01 mag: ![]() = 4.7126 d-1,
= 4.7126 d-1,
![]() =
2.2342 d-1 and
=
2.2342 d-1 and ![]() = 4.671 d-1. We also discovered that this
object is an intrinsically fast rotating Be star. V2104 Cyg is a
particularly interesting case as there are not many precedents for
detection of multiperiodicity in mid-late type Be stars
based on ground-based photometric observations. Indeed, from
previous efforts (Cuypers et al. 1989; Balona et al. 1992) it appears
that detection of multi-periodic signals from ground-based photometry
in Be stars is not easy. Only recently, Gutiérrez-Soto et al. (2006)
claimed to have detected unambiguously several NRP periods in the
light curves of NW Ser (spectral type B3) and V1446 Aql (spectral
type B5). If V2104 Cyg is a multi-periodic non-radial pulsator as
well, it would be the third known Be pulsator with multiperiodic
signals detected in its ground-based light curves.
= 4.671 d-1. We also discovered that this
object is an intrinsically fast rotating Be star. V2104 Cyg is a
particularly interesting case as there are not many precedents for
detection of multiperiodicity in mid-late type Be stars
based on ground-based photometric observations. Indeed, from
previous efforts (Cuypers et al. 1989; Balona et al. 1992) it appears
that detection of multi-periodic signals from ground-based photometry
in Be stars is not easy. Only recently, Gutiérrez-Soto et al. (2006)
claimed to have detected unambiguously several NRP periods in the
light curves of NW Ser (spectral type B3) and V1446 Aql (spectral
type B5). If V2104 Cyg is a multi-periodic non-radial pulsator as
well, it would be the third known Be pulsator with multiperiodic
signals detected in its ground-based light curves.
How can we explain the variability of V2104 Cyg? Short periods of
0.2d, like ![]() and
and ![]() are typically detected in early-B type
stars such as
are typically detected in early-B type
stars such as ![]() Cephei pulsators or early-Be stars, but are
quite unusual in late-type B(e) stars. As V2104 Cyg lies in the
instability domain of the SPBs, far from the overlap domain with the
Cephei pulsators or early-Be stars, but are
quite unusual in late-type B(e) stars. As V2104 Cyg lies in the
instability domain of the SPBs, far from the overlap domain with the
![]() Cephei pulsators, we expect to detect longer periods, such as
Cephei pulsators, we expect to detect longer periods, such as
![]() .
Rivinius et al. (2003) identified
.
Rivinius et al. (2003) identified ![]() g-modes associated
to periods longer than 0.4d in a selected set of Be stars. Given
that V2104 Cyg has a spectral type between B5 and B7 it is worth
noting that the NRP stars in Rivinius et al. (2003) have a spectral
type earlier than B6.
g-modes associated
to periods longer than 0.4d in a selected set of Be stars. Given
that V2104 Cyg has a spectral type between B5 and B7 it is worth
noting that the NRP stars in Rivinius et al. (2003) have a spectral
type earlier than B6.
According to Saio et al. (2007) it is likely that all
rapidly rotating Be stars show NRP.
For fast rotating stars, the comparison of the observed frequencies
![]() with the eigenfrequencies of the star
with the eigenfrequencies of the star
![]() provided by theoretical calculations is not straightforward
(e.g. Berthomieu 1978; Dintrans & Rieutord 2000). The rotation lifts
the degeneracy of the eigenfrequencies of the modes in m and gives
rise to a perturbation of the frequencies (e.g. Saio 1981; Dziembowski
& Goode 1992; Soufi et al. 1998). These frequency shifts depend on
m, the rotation frequency
provided by theoretical calculations is not straightforward
(e.g. Berthomieu 1978; Dintrans & Rieutord 2000). The rotation lifts
the degeneracy of the eigenfrequencies of the modes in m and gives
rise to a perturbation of the frequencies (e.g. Saio 1981; Dziembowski
& Goode 1992; Soufi et al. 1998). These frequency shifts depend on
m, the rotation frequency ![]() ,
and other parameters, and can be
very large, especially for g-modes. This perturbation can explain
why the observed frequencies
,
and other parameters, and can be
very large, especially for g-modes. This perturbation can explain
why the observed frequencies ![]() and
and ![]() of V2104 Cyg are
larger than expected for stars within the instability strip of SPBs.
Moreover, when the oscillation frequency is of the same order as the
rotational frequency, the whole perturbative approach is invalid and
the familiar structure of modes (
of V2104 Cyg are
larger than expected for stars within the instability strip of SPBs.
Moreover, when the oscillation frequency is of the same order as the
rotational frequency, the whole perturbative approach is invalid and
the familiar structure of modes (![]() )
disappears (Dintrans &
Rieutord 2000). Hence, rotation has a significant effect on the
non-adiabatic analysis and mode identification. Consequently it is not
easy to assign l-values to the observed frequencies of a
fast-rotating star, like V2104 Cyg. In particular, the fast rotation of
V2104 Cyg prevents the application of a mode-identification method that does
not account for higher order rotational effects, such as the method of
photometric amplitude ratios made available by Dupret et al. (2003).
A discussion of the
implications of applying standard mode-identification techniques, used
to identify modes in non-rotating stars, to fast-rotating stars can be
found in Townsend (2003).
)
disappears (Dintrans &
Rieutord 2000). Hence, rotation has a significant effect on the
non-adiabatic analysis and mode identification. Consequently it is not
easy to assign l-values to the observed frequencies of a
fast-rotating star, like V2104 Cyg. In particular, the fast rotation of
V2104 Cyg prevents the application of a mode-identification method that does
not account for higher order rotational effects, such as the method of
photometric amplitude ratios made available by Dupret et al. (2003).
A discussion of the
implications of applying standard mode-identification techniques, used
to identify modes in non-rotating stars, to fast-rotating stars can be
found in Townsend (2003).
It is interesting to point out that for V2104 Cyg the
amplitudes associated with ![]() have, unlike those associated with
have, unlike those associated with
![]() and
and
![]() ,
a similar value in all four filters (see
Table 1). In general, the amplitudes of NRP modes in B
stars decrease from the u filter towards the vby
filters. However, similar pulsation amplitudes at different
wavelengths are predicted for some modes of theoretical
models. Several examples can be found in De Cat et al. (2007;
e.g. HD 14053 and HD 89688).
,
a similar value in all four filters (see
Table 1). In general, the amplitudes of NRP modes in B
stars decrease from the u filter towards the vby
filters. However, similar pulsation amplitudes at different
wavelengths are predicted for some modes of theoretical
models. Several examples can be found in De Cat et al. (2007;
e.g. HD 14053 and HD 89688).
An alternative explanation of the observed variability of V2104 Cyg
might be in terms of a model based on rotational modulation. In many
Be stars the detected period is consistent with the expected period of
rotation of the star (Cuypers et al. 1989; Balona et al. 1992). As
seen in Sect. 5, ![]() or
or ![]() might be related with
might be related with
![]() .
Our dataset did not allow a sufficiently tight constraint
on
.
Our dataset did not allow a sufficiently tight constraint
on ![]() to confirm this. The frequency
to confirm this. The frequency
![]() ,
however, is much
lower than the expected rotational frequency. Therefore, a model based
on rotational modulation could not explain the light variability of
V2104 Cyg.
,
however, is much
lower than the expected rotational frequency. Therefore, a model based
on rotational modulation could not explain the light variability of
V2104 Cyg.
The unambiguous detection of photospheric multiperiodicity in a Be star is in favour of a NRP interpretation (e.g. Porter & Rivinius 2003). As we detected 3 independent frequencies in the light curves of V2104 Cyg, the NRP hypothesis currently seems the most plausible explanation. The interpretation of pulsational variability in Be stars is complicated by fast rotation. Recently, theoretical progress on this topic has been made by Townsend (2005), who proposed a new explanation for unstable modes in mid- to late B-type SPB and Be stars in terms of retrograde mixed modes instead of g-modes and by Dziembowski et al. (2007), who found theoretical backing for the observed frequencies in the MOST data of the Be star HD163868 (Walker et al. 2005). The case study of V2104 Cyg, a fast-rotating mid-late Be star with 3 excited modes, is another challenge for theoreticians in the game of matching theory with observations.
A high-resolution spectroscopic time-series of V2104 Cyg could be a
future possible observational progress. As LPV are rarely detected
in late-type Be stars (Baade 1989; Rivinius et al. 2003) it would be
an interesting excercise to see if V2104 Cyg is an exceptional case
in this respect and indeed shows LPV. If present, a line-profile
analysis and subsequent mode-identification will allow
m-values to be assigned to the detected modes. Additionally, a study of the
behaviour of the H![]() emission peak will allow the
properties and behaviour of the circumstellar disk to be studied.
emission peak will allow the
properties and behaviour of the circumstellar disk to be studied.
Acknowledgements
We thank the referee for providing constructive comments which helped improve our conclusions. We thank Marc-Antoine Dupret and Josefina Montalban for sharing their opinion on the mode-identification. K.U. acknowledges financial support from a European Community Marie Curie Intra-European Fellowship, contract number MEIF-CT-2006-024476. E.R. and V.C. acknowledge financial support from the Junta de Andalucía and the Spanish Dirección General de Investigación (DGI) under project AYA2006-06375.