 |
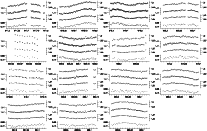
Figure 1: Light curves of V2104 Cyg obtained at SNO and SPMO in October-November 2005. The u (dots), v (stars), b (crosses) and y (+) magnitude differences are plotted in time (HJD-2453000). Note the difference in scale between the u and vby data: tickmarks in the u filter and vby filters correspond to 0.04 mag and 0.03 mag respectively. The light curves of all 15 nights are only available in the on-line version of the paper. |
| Open with DEXTER | |
In the text
 |
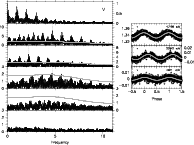
Figure 2:
Left panel: Window function ( top) and SCARGLE
periodograms of V2104 Cyg at different stages of the frequency
search in the Strömgren v filter. The amplitudes are expressed in
mmag. The detected frequencies |
| Open with DEXTER | |
In the text
 |
Figure 3:
The H |
| Open with DEXTER | |
In the text
 |
Figure 4:
Possible position of V2104 Cyg in the Hertzsprung-Russell diagram. The black square
indicates the position derived from the observed photometric indices while
the star indicates the position after correction for the contribution of the
stellar disk. The full
black lines and the dashed black lines represent the instability strips for
the SPB and |
| Open with DEXTER | |
In the text
Full version
 |
Figure 1: Light curves of V2104 Cyg obtained at SNO and SPMO in October-November 2005. The u (dots), v (stars), b (crosses) and y (+) magnitude differences are plotted in time (HJD-2453000). Note the difference in scale between the u and vby data: tickmarks in the u filter and vby filters correspond to 0.04 mag and 0.03 mag respectively. |
| Open with DEXTER | |
In the text