 |
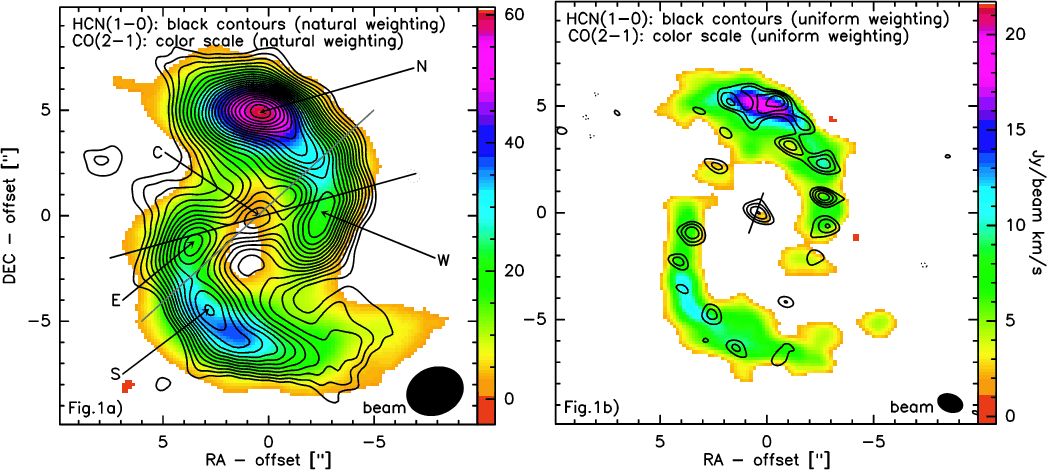
Figure 1:
Integrated HCN(1-0) emission ( black contours) overlaid
on CO(2-1) ( color scale; Schinnerer et al., in prep.,
García-Burillo et al. 2005) in natural ( left; a) and
uniform weighting ( right; b); the CO and HCN emission have been
both integrated from -200 km s-1 to +200 km s-1. We used a uv-taper for
CO to match the angular resolution of our HCN data which is by a
factor of |
| Open with DEXTER | |
In the text
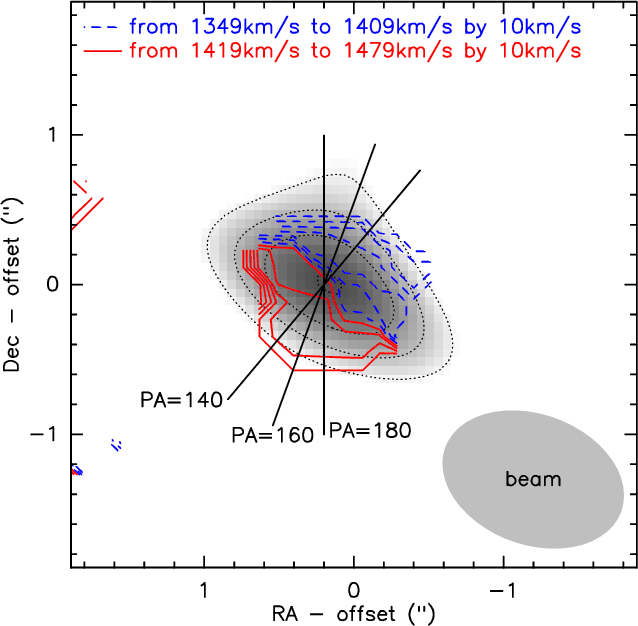 |
Figure 2:
Iso-velocity map of HCN(1-0) ( solid red & dashed
blue lines) overlaid to the integrated HCN(1-0) emission ( grey
scale & grey contours (same as in Fig. 1)). Contours run
from
|
| Open with DEXTER | |
In the text