All Tables
- Table 1:
The sample of the 17 young BDs surveyed in the
XEST. Column (2) gives the reference of the discovery paper. Col. (3)
give the 2MASS counterparts. Column (7) gives the references for the
spectral type (Col. 4), the optical extinction (when not
available derived from
 using Rieke & Lebofsky 1985, Col. 5), and the
reference of the equivalent width of H
using Rieke & Lebofsky 1985, Col. 5), and the
reference of the equivalent width of H (
(
 ,
given in Col. 6) if it is different. Negligible optical extinction in
Col. (5) are indicated by 0. The effective temperature in Col. (8) has
been computed from the spectral type using the temperature scale
,
given in Col. 6) if it is different. Negligible optical extinction in
Col. (5) are indicated by 0. The effective temperature in Col. (8) has
been computed from the spectral type using the temperature scale
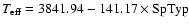 ,
which is valid for young
stars with M spectral type (Guieu et al. 2006). The visual extinction in
Col. (5) is taken when available from the literature; for 2MASS J0421
and 2MASS J0422, we averaged the visual extinction computed from
J-H,
,
which is valid for young
stars with M spectral type (Guieu et al. 2006). The visual extinction in
Col. (5) is taken when available from the literature; for 2MASS J0421
and 2MASS J0422, we averaged the visual extinction computed from
J-H,
 ,
and the spectral type, using a dwarf sequence
(compiled from the literature; e.g., Leggett et al. 1998).
The bolometric luminosity of the substellar photosphere in
Col. (9) has been computed from I, J-band magnitudes and
,
and the spectral type, using a dwarf sequence
(compiled from the literature; e.g., Leggett et al. 1998).
The bolometric luminosity of the substellar photosphere in
Col. (9) has been computed from I, J-band magnitudes and  (see Guieu et al. 2006); for 2MASS J0414 and MHO 4 (without
I-band magnitude available) the reference for the luminosity is
Luhman (2004) and Briceño et al. (2002), respectively. Column (10)
indicates accreting sources based mainly on
(see Sect. 6.2). The last column indicates detection in X-rays
(this work; see Table 2). References:
B98 = Briceño et al. (1998); B02 = Briceño et al. (2002); G06 = Guieu et al. (2006);
L04 = Luhman (2004); L06 = Luhman (2006); M01 = Martín et al. (2001);
M05 = Muzerolle et al. (2005a).
(see Guieu et al. 2006); for 2MASS J0414 and MHO 4 (without
I-band magnitude available) the reference for the luminosity is
Luhman (2004) and Briceño et al. (2002), respectively. Column (10)
indicates accreting sources based mainly on
(see Sect. 6.2). The last column indicates detection in X-rays
(this work; see Table 2). References:
B98 = Briceño et al. (1998); B02 = Briceño et al. (2002); G06 = Guieu et al. (2006);
L04 = Luhman (2004); L06 = Luhman (2006); M01 = Martín et al. (2001);
M05 = Muzerolle et al. (2005a).
- Table 2:
Detection list of young BDs in the XEST. Column (1)
numbers correspond to labels in Fig. 1. Columns (2)-(4)
give the BD, satellite and target names, respectively. The naming
of XMM-Newton sources in Col. (5) follows the convention of Güdel et al. (2007),
where the two and three digits code for the field and the source
number in this field, respectively. Columns (6)-(9) give
X-ray source positions, total positional uncertainties, and distance
to the 2MASS position, respectively. References:
[FGMSD03] = Favata et al. (2003), [BFR03] = Bally et al. (2003).
There is only pn data for X-ray source
#1 as it falls in the gap of the MOS CCDs in window mode in this observation.
X-ray source #4b is affected by pn gap. For X-ray
source #9 only MOS data are available.
- Table 3:
Spectral properties of BDs obtained from spectral fitting. To
fit the spectra (Fig. 4), we used a WABS
absorption model (Morrison & McCammon 1983) combined with one or two
MEKAL optically thin thermal plasma model (Mewe et al. 1995) with 0.3 times
the solar elemental abundances. MEKAL plasma models were computed
rather than
interpolated from a pre-calculated table. We used
 statistics with
standard weighting. Column (4) gives the net source counts collected by
the instrument given in Col. (3). Confidence ranges at the 68% level
(
statistics with
standard weighting. Column (4) gives the net source counts collected by
the instrument given in Col. (3). Confidence ranges at the 68% level
(
 ;
corresponding to
;
corresponding to  for Gaussian
statistics) are given in parentheses. The value of reduced
and
for Gaussian
statistics) are given in parentheses. The value of reduced
and  ,
the degrees of freedom, are indicated in Col. (10). The emission
measures in Cols. (8) and (9) and the X-ray luminosity in the
0.5-8 keV energy range corrected for absorption in Col. (11) were
computed assuming a distance of 140 pc for the TMC.
The X-ray fractional luminosity,
,
the degrees of freedom, are indicated in Col. (10). The emission
measures in Cols. (8) and (9) and the X-ray luminosity in the
0.5-8 keV energy range corrected for absorption in Col. (11) were
computed assuming a distance of 140 pc for the TMC.
The X-ray fractional luminosity,
 ,
is
given in the last column. For CFHT-BD-Tau 1, the second line gives an
estimate of the quiescent X-ray luminosity derived for the light curve
fit (see Sect. 3).
,
is
given in the last column. For CFHT-BD-Tau 1, the second line gives an
estimate of the quiescent X-ray luminosity derived for the light curve
fit (see Sect. 3).
- Table 4:
Spectral properties of BDs obtained from quantile analysis. Column (3)
gives the instrument name (MOS stands for MOS1+MOS2). Column (4) and (5)
indicate the exposure and the
net source counts collected by this instrument (i.e. for MOS the
exposure average and the sum of net source counts). Column (6) gives the
energies below which the net counts are 25%, 50%, and 75% of the
source net counts in the 0.5-7.3 keV energy range. The resulting
position in the quantile diagram (Fig. 5) is given in
Col. (7). The observed optical extinctions (see Table 1) were used to
disentangle temperature double solutions in the quantile diagram (#2 on pn), and
to estimate the hydrogen column density (Col. 8) for sources with low
constraint in the quantile diagram (#2, #6 and #7 on pn, and #9
on MOS), using the relation
 cm-2 mag-1 (Cardelli et al. 1989; Vuong et al. 2003);
these values are between brackets in Col. 8. Where negligible optical
extinction was measured, we adopted
cm-2 mag-1 (Cardelli et al. 1989; Vuong et al. 2003);
these values are between brackets in Col. 8. Where negligible optical
extinction was measured, we adopted
 cm-2. When no constraint on the plasma temperature was
obtained, we adopted 1 keV (value between brackets in Col. 9). The
X-ray luminosity in the 0.5-8 keV energy range corrected for
absorption in Col. (10) was computed assuming a distance of 140 pc
for the TMC. The X-ray fractional luminosity,
,
is given in the last column.
cm-2. When no constraint on the plasma temperature was
obtained, we adopted 1 keV (value between brackets in Col. 9). The
X-ray luminosity in the 0.5-8 keV energy range corrected for
absorption in Col. (10) was computed assuming a distance of 140 pc
for the TMC. The X-ray fractional luminosity,
,
is given in the last column.
- Table 5:
Upper limits to the BD X-ray luminosities. The hydrogen column
density in unit of 1021 cm-2 given in Col. (3) is obtained
from the optical extinction using the relation
 cm-2 mag-1 (Cardelli et al. 1989; Vuong et al. 2003). Exposure times in
Col. (4) are for summed EPIC (pn+M1+M2) data, in units equivalent for
a pn-on-axis observation. Columns (5) and (6) give the upper limits at
the 95% confidence level for net counts in the 0.5-2 keV energy
range and the X-ray luminosity in the 0.5-8 keV energy range
corrected for absorption, respectively. The upper limit to the
X-ray fractional luminosity,
,
is given in
the last column.
cm-2 mag-1 (Cardelli et al. 1989; Vuong et al. 2003). Exposure times in
Col. (4) are for summed EPIC (pn+M1+M2) data, in units equivalent for
a pn-on-axis observation. Columns (5) and (6) give the upper limits at
the 95% confidence level for net counts in the 0.5-2 keV energy
range and the X-ray luminosity in the 0.5-8 keV energy range
corrected for absorption, respectively. The upper limit to the
X-ray fractional luminosity,
,
is given in
the last column.
- Table A.1:
Archival Chandra observations which surveyed
serendipitously the TMC BDs. Column (1) gives the name of the
instrument used: "I'' (
 field of view) and "S''
(
field of view) and "S''
(
 field of view) for imaging and spectroscopy ACIS
CCD (Garmire et al. 2003), respectively. Column (8) give the name of the
TMC BD whitin the Chandra field of view. Column (9) indicates whether we use this archival
data to supplement the XEST or not (see following notes). Notes:
in the ACIS-S observation #3364, the TMC BD KPNO-Tau 2 was located
13
field of view) for imaging and spectroscopy ACIS
CCD (Garmire et al. 2003), respectively. Column (8) give the name of the
TMC BD whitin the Chandra field of view. Column (9) indicates whether we use this archival
data to supplement the XEST or not (see following notes). Notes:
in the ACIS-S observation #3364, the TMC BD KPNO-Tau 2 was located
13 off-axis on ACIS-S2, and it is not detected; we obtained here a better
constraint on the X-ray luminosity of this BD using the sum of the
two XMM-Newton exposures, rather than this ACIS-S observation. In the ACIS-S
observation #4488, the TMC BD 2MASS J0421 was located
5.7 off-axis on ACIS-S3, the pipeline detection algorithm found
no source at this location.
off-axis on ACIS-S2, and it is not detected; we obtained here a better
constraint on the X-ray luminosity of this BD using the sum of the
two XMM-Newton exposures, rather than this ACIS-S observation. In the ACIS-S
observation #4488, the TMC BD 2MASS J0421 was located
5.7 off-axis on ACIS-S3, the pipeline detection algorithm found
no source at this location.