![\begin{figure}
\par\includegraphics[width=8.1cm,clip]{6067f1.ps}\end{figure}](/articles/aa/full/2007/12/aa6067-06/Timg31.gif) |
Figure 1: Best fit model SED to the redshift- and extinction-corrected observed spectrum of UM 462c. The model SED is calculated assuming that the H II region is ionisation-bounded. It is seen that the red part of spectrum is fitted quite well whereas the modelled SED underestimates the flux shortward of the Balmer jump. This is likely due to the leakage of ionising photons from the H II region. |
| Open with DEXTER | |
In the text
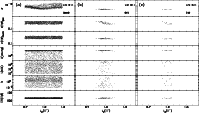 |
Figure 2:
a) Example of the parameter space explored with the Monte Carlo technique (2253 solutions out of 105 simulations) to fit the spectrum of the
BCD UM 311. The parameters shown are the equivalent width of the H |
| Open with DEXTER | |
In the text
 |
Figure 4:
a) Comparison of the |
| Open with DEXTER | |
In the text
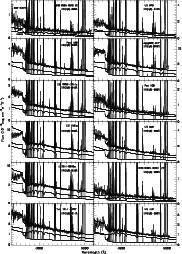 |
Figure 3: Best fit model SEDs (thick solid lines) superposed by the redshift- and extinction-corrected 3.6 m spectra of 69 H II regions in 45 blue compact dwarf galaxies. The separate contributions from the stellar and ionised gas components are shown by thin solid lines (see the labels in the upper left panel of each page). Names of the SDSS objects are given in short form without seconds. |
| Open with DEXTER | |
In the text
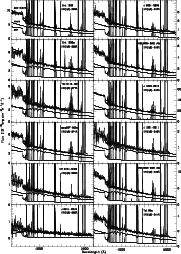 |
Figure 3: continued. |
| Open with DEXTER | |
In the text
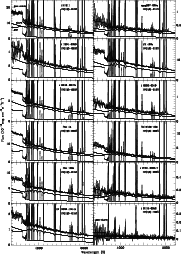 |
Figure 3: continued. |
| Open with DEXTER | |
In the text
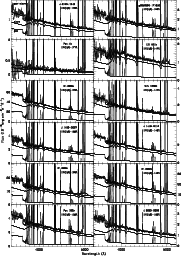 |
Figure 3: continued. |
| Open with DEXTER | |
In the text
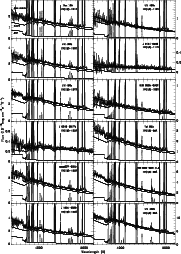 |
Figure 3: continued. |
| Open with DEXTER | |
In the text
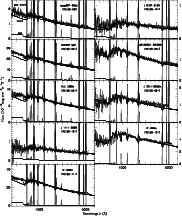 |
Figure 3: continued. |
| Open with DEXTER | |
In the text