![\begin{figure}
\par\includegraphics[width=7.8cm,clip]{6427f1.eps}\end{figure}](/articles/aa/full/2007/10/aa6427-06/Timg12.gif) |
Figure 1:
The temperature profile of the simulated cluster. The temperature rises from about 4 keV at the center up to 11 keV at the scale radius, before decreasing in the outskirts. The profile is derived from the data of Allen et al. (2001) as in Zakamska & Narayan (2003) for Abell 2390. Beyond the scale radius the profile goes as
|
| Open with DEXTER | |
In the text
![\begin{figure}
\par\includegraphics[width=7.8cm,clip]{6427f2.eps}\end{figure}](/articles/aa/full/2007/10/aa6427-06/Timg24.gif) |
Figure 2:
The value of the cooling time
|
| Open with DEXTER | |
In the text
 |
Figure 3: The evolution of the profiles of some of the ICM quantities due to cooling, in the absence of cavities. The plot shows the evolution of temperature T, electron density n, entropy s = T/n2/3, and pressure P in the central part of the cluster. Profiles are obtained from the CO2 (solid lines) and CO (dashed lines) simulations by averaging over radial bins, assuming a bin interval of 3 kpc. The time evolution for the CO2 simulation is represented by the line thickness, which decreases with time. Profiles are computed with an interval of 50 Myr from the initial conditions up to t = 250 Myr. The dashed lines represent the profiles of the same quantities in the CO simulation at t=250 Myr and t=500 Myr. Squares have been added to the profiles of the CO simulation at t=250 Myr to aid comparison with the CO2 case. |
| Open with DEXTER | |
In the text
![\begin{figure}
\par\includegraphics[width=17cm]{6427f4CMJN.eps}\end{figure}](/articles/aa/full/2007/10/aa6427-06/Timg38.gif) |
Figure 4:
The evolution of the pressure field from t=0 up to t=10 Myr
for the simulation SB1011 in the region around the bubble, with the velocity field superimposed.
The first picture shows the border of the bubble as well as a velocity vector corresponding to v = 1000 km s-1. Thelast snapshot shows the region occupied by the fluid elements containing at least 90% hot plasma at t=10 Myr, with the initial position ofthe bubble superimposed on it.
The bubble rises |
| Open with DEXTER | |
In the text
![\begin{figure}
\par\includegraphics[width=17cm]{6427f5.eps}\end{figure}](/articles/aa/full/2007/10/aa6427-06/Timg40.gif) |
Figure 5: Map of the temperature in the SB1011 simulation showing the evolution of the plasma bubble in the first 120 Myr. The pictures clearly show the effect of the entrained cold gas, which penetrates and finally bisects the ICM bubble, leaving a vortex ring. |
| Open with DEXTER | |
In the text
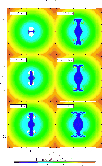 |
Figure 6: The evolution of the ICM temperature in the SB1011 simulation from the beginning of the simulation up to t=250 Myr. The bubble plasma seems almost completely diffused into the ICM in last snapshot, but it is still preserved in remnants of the vortex ring that do not intersect the plane of the image. The pictures show the entrainment of cold gas along the vertical axis, the establishment of a cold cap at large radii, the fall back of the cold gas and the development of the cooling flow. |
| Open with DEXTER | |
In the text
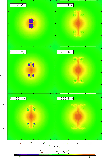 |
Figure 7: The evolution of the density in the SB1011 simulation up to t=250 Myr. The snapshots show the denser material that is uplifted by the vortex circulation and later sustained at large radii by the buoyancy of the vortex ring. |
| Open with DEXTER | |
In the text
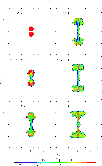 |
Figure 8: The fraction of bubble plasma in the fluid elements in the SB1011 simulation up to t=250 Myr. The comparison with Figs. 6 and 7 shows that as the simulation goes on, most of the bubble plasma is indeed mixed with the ICM to low temperature and high density, and under these conditions it should no longer be treated as relativistic. The reader should be careful of the logarithmic color scale. |
| Open with DEXTER | |
In the text
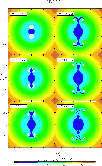 |
Figure 9: The evolution of the temperature in the SB1020 simulation. |
| Open with DEXTER | |
In the text
 |
Figure 10:
The height of the centroid of the plasma material during each run
for the complete set of bubble simulations. The dashed lines describe the height of the centroid
of all the bubble plasma, while the solid lines depict the same quantity for the plasma that is hotter than
|
| Open with DEXTER | |
In the text
 |
Figure 11:
The fraction of bubble plasma that maintains a temperature
|
| Open with DEXTER | |
In the text
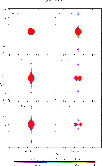 |
Figure 12: The evolution of the material initially inside r=10 kpc in run SB1020. It is first stretched by the rise of the bubbles and later displaced into a torus around the center by the material falling along the trunks. |
| Open with DEXTER | |
In the text
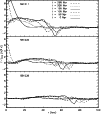 |
Figure 13: The difference between the temperature profile of the simulations hosting bubbles and the CO2 case. |
| Open with DEXTER | |
In the text
 |
Figure 14: Profiles of the fraction of the internal energy due to the bubble plasma. The ratio is computed assuming that the fraction of plasma in each radial shell still hosts the same specific energy as in the initial conditions. |
| Open with DEXTER | |
In the text