![\begin{figure}
\par {\includegraphics[width=16.5cm,clip]{5030fig1.ps} }
\end{figure}](/articles/aa/full/2007/05/aa5030-06/Timg34.gif) |
Figure 1:
Color composite BVR-image of the DEEP1b field with north
up and east to the left. The image covers the entire WFI field of
|
| Open with DEXTER | |
In the text
![\begin{figure}
\par {\includegraphics[width=7.4cm,clip]{5030fig2.ps} }
\end{figure}](/articles/aa/full/2007/05/aa5030-06/Timg36.gif) |
Figure 2: Distribution of separations bewtween radio sources and the nearest R-detected sources for DEEP1a ( upper panel), DEEP1b ( middle panel) and DEEP1c ( lower panel). The dashed histograms show those considered as actual counterparts. |
| Open with DEXTER | |
In the text
![\begin{figure}
\par {\includegraphics[width=7.4cm,clip]{5030fig3.ps} }\end{figure}](/articles/aa/full/2007/05/aa5030-06/Timg37.gif) |
Figure 3: Radio-optical offset computed for all the optical counterparts in the fields DEEP1 a,b,c. The 2 arcsec circle defines the boundaries of those considered to be "good'' identifications. Also reported are the values of the median of the offset distribution in right ascension anddeclination. |
| Open with DEXTER | |
In the text
![\begin{figure}
\par\includegraphics[width=10cm,clip]{5030fig4.ps}
\end{figure}](/articles/aa/full/2007/05/aa5030-06/Timg42.gif) |
Figure 4:
Color-color diagram. In the figure is plotted the
|
| Open with DEXTER | |
In the text
![\begin{figure}
\par\includegraphics[width=8.8cm]{5030fig5.ps}
\end{figure}](/articles/aa/full/2007/05/aa5030-06/Timg50.gif) |
Figure A.1: Galaxy number counts for the fields in the DEEP1 region (solid points) compared to those of Arnouts et al. (2001) (open squares) and Metcalfe et al. (2001) (open triangles). The passband, filter identification number and field are indicated in each panel. |
In the text
![\begin{figure}
\par\includegraphics[width=11.2cm]{5030fig6.ps}
\end{figure}](/articles/aa/full/2007/05/aa5030-06/Timg51.gif) |
Figure A.2: Same as in Fig. A.1 for region Deep2. |
In the text
![\begin{figure}
\par\includegraphics[width=11.2cm]{5030fig7.ps}
\end{figure}](/articles/aa/full/2007/05/aa5030-06/Timg52.gif) |
Figure A.3: Same as in Fig. A.1 for region Deep3. |
In the text
![\begin{figure}
\par\includegraphics[width=8.8cm]{5030fig8.ps}
\end{figure}](/articles/aa/full/2007/05/aa5030-06/Timg53.gif) |
Figure B.1: Stellar number counts (black points) compared with model predictions (solid line) from Girardi et al. (2005). The passband, filter identification number and field are indicated in each panel. |
In the text
![\begin{figure}
\par\includegraphics[width=11.2cm]{5030fig9.ps}
\end{figure}](/articles/aa/full/2007/05/aa5030-06/Timg54.gif) |
Figure B.2: Same as Fig. B.1 but for the DEEP2 region. |
In the text
![\begin{figure}
\par\includegraphics[width=11.2cm]{5030fg10.ps}
\end{figure}](/articles/aa/full/2007/05/aa5030-06/Timg55.gif) |
Figure B.3: Same as Fig. B.1 but for the DEEP3 region. |
In the text
 |
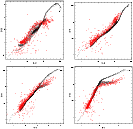
Figure C.1: Color-color plot for stars (red points) selected in the field DEEP1b compared the model of Girardi et al. (2005) (black points). |
In the text
 |
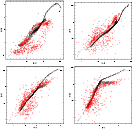
Figure C.2: Same as Fig. C.1 but for field DEEP2b. |
In the text
 |
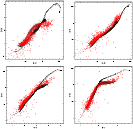
Figure C.3: Same as Fig. C.1 but for field DEEP3b. |
In the text
 |
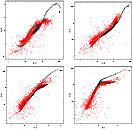
Figure C.4: Same as Fig. C.1 but for field DEEP3c. |
In the text