 |
Figure 1: The MACHO V and V-R phase diagram, converted to the standard Johnson V and Kron-Cousins R, constructed with a period of 112.97 days, and a zero phase at deep minimum at JD 2 448 673.384. For the V-R colour diagram, only the simultaneous measurements in both bands are shown. At the bottom, the phases of the photometric and spectroscopic data are given. The symbols of the spectroscopic data are as follows: the full triangles are low resolution spectra presented in Pollard & Lloyd Evans (2000); the open ones are discussed in Lloyd Evans & Pollard (2004); the phase of the UVES spectrum (0.93) is shown with a hexagon. |
| Open with DEXTER | |
In the text
 |
Figure 2: The spectral energy distribution (SED) of MACHO 47.2496.8. Diamonds are the measured magnitudes (converted to fluxes): Geneva U, B, V and Cousins R taken with C2+Euler, I from DENIS (in gray), and SAAO J, H, K (see also Table 2). The MARCS model is shown in gray, while a smoothed version is shown in a full black line. The minimisation is made using the unsmoothed model in combination with the specific passbands of the photometric filters involved. The I magnitude could not be fitted, and is excluded in the minimisation. Possibly a phase difference is causing this discrepancy. |
| Open with DEXTER | |
In the text
 |
Figure 3: The abundances of MACHO 47.2496.8 relative to iron [el/Fe]. |
| Open with DEXTER | |
In the text
 |
Figure 4: The VLT-UVES spectrum of MACHO 47.2496.8 (points) around the C24737 Å band head, overplotted with two spectrum syntheses with a different 12C/13C isotopic ratio. |
| Open with DEXTER | |
In the text
 |
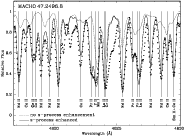
Figure 5: The VLT-UVES spectrum of MACHO 47.2496.8 (points) overplotted with two spectrum syntheses. Both syntheses are made with the same model atmosphere, only the abundances of the s-process elements differ. The synthesis in the dotted line is made with solar abundances for the s-process elements (obviously scaled down to the metallicity of MACHO 47.2496.8), while the synthesis in the full line is made with the enhanced s-process abundances as tabulated in Table 4. The observed spectrum is very well reproduced by the spectrum synthesis, although there are clearly still some lines missing in the line lists. |
| Open with DEXTER | |
In the text
 |
Figure 6: Synthesis of the Pb I line at 4057.81 Å. The exact position of the continuum is far from clear in the vicinity of the line, which makes it only possible to derive an upper limit for the Pb abundance. |
| Open with DEXTER | |
In the text