![\begin{figure}
\par\resizebox{15cm}{!}{\includegraphics[bb=24 250 550 780,clip]{5602fig1.eps}}\end{figure}](/articles/aa/full/2006/48/aa5602-06/Timg27.gif) |
Figure 1: Celestial polar projection of the stars observed in SACY. Stars classified as young according to their Li I equivalent width (see Sect. 4.2) are plotted as filled circles. More evolved stars are indicated as open circles. The transverse curve represents the Galactic plane. |
| Open with DEXTER | |
In the text
 |
Figure 2:
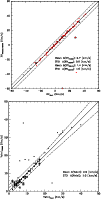
Comparison of our derived radial velocities and |
| Open with DEXTER | |
In the text
![\begin{figure}
\par\includegraphics[angle=-90,width=8.6cm,clip]{5602fig3.eps}\end{figure}](/articles/aa/full/2006/48/aa5602-06/Timg49.gif) |
Figure 3:
Our spectral types as a function of the
|
| Open with DEXTER | |
In the text
![\begin{figure}
\par\resizebox{8.8cm}{!}{\includegraphics[bb=50 269 530 769,clip]{5602fig4.eps}}\end{figure}](/articles/aa/full/2006/48/aa5602-06/Timg50.gif) |
Figure 4:
Distribution of Li equivalent width as a function of the
|
| Open with DEXTER | |
In the text
![\begin{figure}
\par\mbox{\parbox{8.5cm}
{\raggedleft\resizebox{8.5cm}{!}{\includ...
...}{
\includegraphics[bb=108 222 474 574,clip]{5602fig5.eps} }} }
\par\end{figure}](/articles/aa/full/2006/48/aa5602-06/Timg52.gif) |
Figure 5: The convergence method. Left: As a first step, a concentration around a point in the UVW-space is found. The position of the stars defining this concentration at the HR diagram and their Li equivalent width give a first estimation for the age of the association. Right: Starting with an age and an initial ( UVW)0 determined in step 1, we look for the stars in the young sample which fit the association. |
| Open with DEXTER | |
In the text
 |
Figure 6:
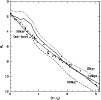
HR diagram from the proposed members of the |
| Open with DEXTER | |
In the text
 |
Figure 7:
Correlation between the X-position and U-component of space velocity vector showing an expansion of the members of the |
| Open with DEXTER | |
In the text
 |
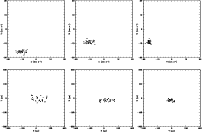
Figure 8: Combinations of the sub-spaces of the UVWXYZ-space showing a well defined clustering in both kinematical and spatial coordinates. |
| Open with DEXTER | |
In the text
 |
Figure 9:
Distribution of Li equivalent width as a function of the
|
| Open with DEXTER | |
In the text
 |
Figure 10:
Distribution of Li abundances as a function of the effective temperature for the
proposed members of the |
| Open with DEXTER | |
In the text