![\begin{figure}
\par\includegraphics[width=7cm,clip]{KerrPaWi1.ps}
\end{figure}](/articles/aa/full/2006/41/aa4193-05/Timg49.gif) |
Figure 1:
The black hole event horizon |
| Open with DEXTER | |
In the text
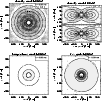 |
Figure 2:
Initial configuration at the start of the simulations for model r00-64.
The density is displayed in the orbital plane ( left) and in two orthogonal
planes perpendicular to the equator ( right).
It is given in g cm-3with contours spaced logarithmically in steps of 0.5 dex.
The arrows in the density plots indicate the velocity field.
The temperature and electron fraction ( |
| Open with DEXTER | |
In the text
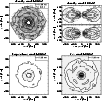 |
Figure 3:
Density distribution for models r00-64 in the orbital plane ( left) and
perpendicular to it ( right) at about 11 ms after the start of the
simulations.
It is given in g cm-3with contours spaced logarithmically in steps of 0.5 dex.
The arrows in the density plots indicate the velocity field.
The temperature and electron fraction ( |
| Open with DEXTER | |
In the text
 |
Figure 4: Mass accretion rate of the black hole and and gas mass on the grid as functions of time for models r00-64, al3-64 and al4-64 with increasing disk viscosity. Gas mass on the grid as functions of time for the reference model r00-64, the low-mass torus model ir1-64, and the high-mass torus models ir4-64, ir5-64, ri4-64, and ar2-64. |
| Open with DEXTER | |
In the text
 |
Figure 5:
Density and temperature distribution for models al3-64 ( left)
and al4-64 ( right) with disk viscosities of
|
| Open with DEXTER | |
In the text
| |
Figure 6: Maximum values of gas density ( left) and temperature ( right) on the grid as functions of time for models r00-64, al3-64 and al4-64 with increasing disk viscosity. |
| Open with DEXTER | |
In the text
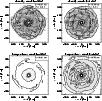 |
Figure 7:
Density and temperature distribution for models ro2-64 ( left)
and ar1-64 ( right) for a corotating black hole, with disk viscosities
of
|
| Open with DEXTER | |
In the text
 |
Figure 8:
Left panels:
the dots represent the azimuthal
velocities
|
| Open with DEXTER | |
In the text
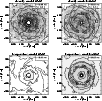 |
Figure 9:
Density and temperature distribution for high-mass torus models with
nonrotating black hole and without disk viscosity (ir4-64; left) and
with corotating black hole and disk viscosity
|
| Open with DEXTER | |
In the text
![\begin{figure}
\par\mbox{\includegraphics[width=4.4cm,clip]{neuIIdw2p.ps} ~~
\includegraphics[width=4.4cm,clip]{ensIIdw2p.ps} }
\par\end{figure}](/articles/aa/full/2006/41/aa4193-05/Timg86.gif) |
Figure 10: Total neutrino luminosities ( left) and cumulative energy radiated in neutrinos ( right) as functions of time for the reference model r00-64, the low-mass torus model ir1-64, and the high-mass torus models ir4-64, ir5-64, ri4-64, and ar2-64. |
| Open with DEXTER | |
In the text
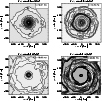 |
Figure 11: Electron fraction in the orbital plane for models ro2-64, ar1-64, ir4-64 and ar2-64, in the orbital plane at about 11 ms after the start of the simulations. The contours are spaced linearly in steps of 0.02. |
| Open with DEXTER | |
In the text
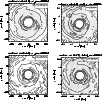 |
Figure 12: Neutrino energy loss rates per unit area in the orbital plane for model r00-64 at 20 ms after the start of the simulations. The plotted values show the logarithm of the rates in erg cm-2 s-1, obtained by integration of the local energy loss rates per unit of volume from z = 0 to infinity. The top left panel gives the results for electron neutrinos, the top right panel for electron antineutrinos, the lower left panel for the sum of muon and tau neutrinos and antineutrinos, and the lower right panel the total values for neutrinos and antineutrinos of all flavors. The contours are spaced in steps of 0.5 dex, bold lines are labelled with their corresponding values. The grey shading emphasises the emission levels, dark grey representing the largest energy loss by neutrino emission. |
| Open with DEXTER | |
In the text
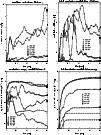 |
Figure 13:
Conversion efficiency of rest-mass energy to neutrinos,
|
| Open with DEXTER | |
In the text
 |
Figure 14:
Integral rate of energy deposition by neutrino-antineutrino
annihilation around the accretion torus,
|
| Open with DEXTER | |
In the text
 |
Figure 15:
Maps of the local energy deposition rates
(in erg cm-3 s-1) by
|
| Open with DEXTER | |
In the text