 |
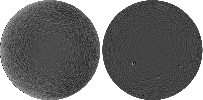
Figure 1: Comparison of the real dopplergram ( left, observed by MDI/SoHO) and the simulated one ( right). Both images are visually very similar. The black colour means line-of-sight velocity -700 m s-1 (towards an observer) while white represents +700 m s-1. |
| Open with DEXTER | |
In the text
 |
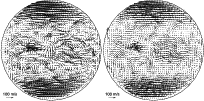
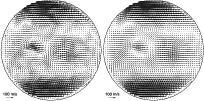
Figure 2: Left - model vector velocity field. Right - a velocity field that was computed by applying the LCT method to the synthetic supergranulation pattern with the imposed model field. The arrow lengths, representing the velocity magnitudes, have the same scale. The images are visually very similar, however the magnitudes of calculated velocities are underestimated. |
| Open with DEXTER | |
In the text
 |
Figure 3: Scatter plot for inference of the calibration curve. Magnitudes of calculated velocities are slightly underestimated by LCT, but the linear behaviour is clearly visible. A line representing the 1:1 ratio is displayed. The calibration affects only the magnitudes of the flows, while the directions do not need any correction. |
| Open with DEXTER | |
In the text
 |
Figure 4:
Dependence of the 1- |
| Open with DEXTER | |
In the text
 |
Figure 5:
Influence of the calculated velocity field on the choice of FWHM of the correlation window. Left - 120
|
| Open with DEXTER | |
In the text
 |
Figure 6: Histograms of velocity magnitudes for various FWHM of the LCT algorithm. |
| Open with DEXTER | |
In the text