![\begin{figure}
\par\includegraphics[width=7.7cm,clip]{4995fi01.ps}
\end{figure}](/articles/aa/full/2006/36/aa4995-06/Timg338.gif) |
Figure 1:
Effective temperatures as a function of spectral type for
SMC objects studied in this paper. Dwarfs, giants and supergiants
are denoted by, respectively, solid circles, triangles and
squares. Shown with a solid line is the average
|
| Open with DEXTER | |
In the text
![\begin{figure}
\par\includegraphics[width=8cm,clip]{4995fi02.ps}
\end{figure}](/articles/aa/full/2006/36/aa4995-06/Timg344.gif) |
Figure 2: Number of Lyman continuum ionising photons Q0 as a function of spectral type. Different luminosity classes are shown using circles, triangles and squares for, respectively, IV-V, III and I-II class objects. Grey circles correspond to stars located on or left of the ZAMS. Indicated using a dashed line is the Galactic calibration for dwarfs from Martins et al. (2005a). |
| Open with DEXTER | |
In the text
![\begin{figure}
\par\includegraphics[width=8.1cm,clip]{4995fi03.ps}
\end{figure}](/articles/aa/full/2006/36/aa4995-06/Timg351.gif) |
Figure 3:
Distribution of the analysed SMC objects in the
|
| Open with DEXTER | |
In the text
![\begin{figure}
\par\includegraphics[width=7.7cm,clip]{4995fi04.ps}
\end{figure}](/articles/aa/full/2006/36/aa4995-06/Timg353.gif) |
Figure 4:
Comparison of spectroscopically determined masses with
masses derived from the evolutionary tracks of Charbonnel et al. (1993)
for
|
| Open with DEXTER | |
In the text
![\begin{figure}
\par\includegraphics[width=8cm,clip]{4995fi05.ps}
\end{figure}](/articles/aa/full/2006/36/aa4995-06/Timg358.gif) |
Figure 5:
Helium abundances as a function of surface
gravity. Luminosity classes IV-V, III and I-II are denoted using
circles, triangles and squares, respectively. Open symbols
correspond to fast rotators (
|
| Open with DEXTER | |
In the text
![\begin{figure}
\par\includegraphics[width=8.4cm,clip]{4995fi06.ps}
\end{figure}](/articles/aa/full/2006/36/aa4995-06/Timg359.gif) |
Figure 6:
HR-diagram of the analysed SMC sample. Different luminosity
classes are distinguished using identical symbols as used in
Fig. 5. Open symbols correspond to objects with a helium
abundance of at least 0.12. Over-plotted in grey are the
evolutionary tracks of Maeder & Meynet (2001) and Meynet & Maeder (2005) with
|
| Open with DEXTER | |
In the text
![\begin{figure}
\par\includegraphics[width=8.2cm,clip]{4995fi07.ps}
\end{figure}](/articles/aa/full/2006/36/aa4995-06/Timg367.gif) |
Figure 7:
The mass discrepancy (see also Fig. 4) as a
function of surface helium abundance. To compute the discrepancy
non-rotating tracks of Charbonnel et al. (1993) are used. Circles,
triangles, and squares denote dwarfs, giants, and supergiants,
respectively. The open circles indicate stars on or left of the
ZAMS. The bulk of the stars have the initial helium abundance
|
| Open with DEXTER | |
In the text
![\begin{figure}
\par\includegraphics[width=9cm,clip]{4995fi08.ps}
\end{figure}](/articles/aa/full/2006/36/aa4995-06/Timg376.gif) |
Figure 8:
Modified wind momentum (
|
| Open with DEXTER | |
In the text
![\begin{figure}
\par\includegraphics[width=14.1cm,clip]{4995fi09.ps}
\end{figure}](/articles/aa/full/2006/36/aa4995-06/Timg388.gif) |
Figure 9:
Comparison of
|
| Open with DEXTER | |
In the text
![\begin{figure}
\par\includegraphics[width=14.2cm,clip]{4995fi10.ps}
\end{figure}](/articles/aa/full/2006/36/aa4995-06/Timg397.gif) |
Figure 10:
Left panel: cdfs of observed (solid line) and
theoretical initial
|
| Open with DEXTER | |
In the text
![\begin{figure}
\par\includegraphics[width=7.8cm,clip]{4995fi11.ps}
\end{figure}](/articles/aa/full/2006/36/aa4995-06/Timg410.gif) |
Figure 11:
Best fitting model |
| Open with DEXTER | |
In the text
![\begin{figure}
\par\includegraphics[width=7.8cm,clip]{4995fi12.ps}
\end{figure}](/articles/aa/full/2006/36/aa4995-06/Timg416.gif) |
Figure 12: Comparison of mass loss rates determined in this study using the optical spectrum with values determined from the UV spectrum. For the three objects with the lowest mass loss rates the values determined from the optical spectra correspond to upper limits. |
| Open with DEXTER | |
In the text
![\begin{figure}
\par\includegraphics[width=12.5cm,clip]{4995fi13.ps}
\end{figure}](/articles/aa/full/2006/36/aa4995-06/Timg419.gif) |
Figure 13: Comparison of the programme stars located in NGC 346 with isochrones for zero age, 1, 2, 3, 4, 5 and 7 Myr derived from the non rotating evolutionary models of Charbonnel et al. (1993) (dashed lines) and models including rotation from Maeder & Meynet (2001) and Meynet & Maeder (2005) (dotted lines). For reference the tracks of the rotating models are also shown (grey lines, see Fig. 6 for initial masses of these tracks), where for clarity purpose only the blueward part of the evolution of the most massive tracks is plotted. Shown with identical symbols as in Fig. 5 are our programme stars, which are located in NGC 346. Luminosity class Vz objects are denoted using grey circles. See text for a discussion. |
| Open with DEXTER | |
In the text
![\begin{figure}
\par\includegraphics[width=12cm,clip]{4995fi14.ps}
\end{figure}](/articles/aa/full/2006/36/aa4995-06/Timg424.gif) |
Figure 14: Age determination of the programme stars in NGC 346 using the non-rotating SMC models of Charbonnel et al. (1993) (open symbols) and those including rotation (Maeder & Meynet 2001; Meynet & Maeder 2005) (closed symbols). Circles, triangles, and squares denote dwarfs, giants, and supergiants, respectively. The horizontal axis gives the ID number of the star (see e.g. Table 3); the vertical axis the age in Myr. The lower limits (upwards pointing arrows) provide age estimates from tracks of chemically homogeneous evolution (Yoon et al. in preparation); see text for a discussion. |
| Open with DEXTER | |
In the text
In the text
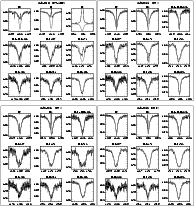 |
Figure A.2: Same as Fig. A.1, however, for NGC 346-018, -022, -025 and -026. |
In the text
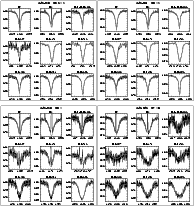 |
Figure A.3: Same as Fig. A.1, however, for NGC 346-028, -031, -033 and -046. |
In the text
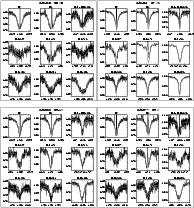 |
Figure A.4: Same as Fig. A.1, however, for NGC 346-050, -051, -066 and -077. |
In the text
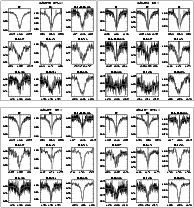 |
Figure A.5: Same as Fig. A.1, however, for NGC 346-090, -093, -097 and -107. |
In the text
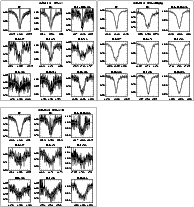 |
Figure A.6: Same as Fig. A.1, however, for NGC 346-112, NGC 330-031 and -052. |
In the text
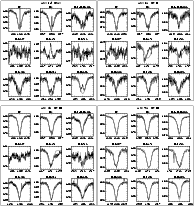 |
Figure A.7: Same as Fig. A.1, however, for AzV 14, 15, 26 and 95. |
In the text
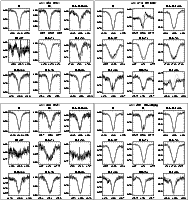 |
Figure A.8:
Same as Fig. A.1, however, for AzV 243, 372,
388 and 469. Shown with a dotted line for AzV 372 is the effect of
an increase of the mass loss rate by 0.1 dex on the line profiles of
H |
In the text
