 |
Figure 1:
FUV contours overlaid on a grey-scale representation of the
H I integrated intensity map of the Western part of the inner disk of
M 81. Overlaid are the fields of our NRO and OVRO observations,
as well as the fields observed by Brouillet et al. (1998, labelled
B98), and by Taylor & Wilson (1998; labelled TW98). Contour levels for
the FUV are
2.3, 3.1, 4.6, 6.2, 7.7, 9.2, 13.9, 18.5 and
|
| Open with DEXTER | |
In the text
 |
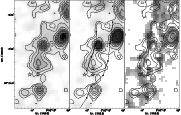
Figure 2:
The region of the spiral arm in M 81 studied in the present
paper. Contours in all three panels are of the FUV emission, and
contour levels are
2.3, 3.1, 4.6, 6.2, 7.7, 9.2, 13.9, 18.5 and
|
| Open with DEXTER | |
In the text
 |
Figure 3: Positions of the NRO 45 m beam pointings, overlaid on the H I map as shown in the right panel of Fig. 2. Grey levels as in Fig. 2. Letters denote positions where CO was detected (see text); less secure detections are denoted by letters in parentheses. |
| Open with DEXTER | |
In the text
 |
Figure 4:
Final CO(1-0) spectra from NRO (drawn lines), smoothed
to
|
| Open with DEXTER | |
In the text