![\begin{figure}
\par\subfigure[]{\includegraphics[width=14.5cm]{4872fi1a.ps} }
\subfigure[]{\includegraphics[width=14.5cm]{4872fi1b.ps} }\end{figure}](/articles/aa/full/2006/31/aa4872-06/img30.gif) |
Figure 1:
Bessel-R, Bessel-I broad-band images and F810, F815,
and F823 narrow-band images of 2 examples of our targets: a)
the second brightest candidate (No. 12); b) object with an
intermediate flux and visible in two narrow-band filters (No. 13).
Each image shows a 10
|
| Open with DEXTER | |
In the text
![\begin{figure}
\par\mbox{\subfigure[FDFLAE-1]{\includegraphics[clip=true,width=5...
...-7757]{\includegraphics[clip=true,width=5.5cm]{4872fi2i.ps} }}
\par
\end{figure}](/articles/aa/full/2006/31/aa4872-06/img32.gif) |
Figure 2:
Observed emission line profiles of the LAE candidates. For comparison the [OII] 3727 doublet of FDF-7757 at
|
| Open with DEXTER | |
In the text
![\begin{figure}
\par\includegraphics[width=15cm,clip]{4872fi3.ps}
\end{figure}](/articles/aa/full/2006/31/aa4872-06/img35.gif) |
Figure 3:
The spatial distribution of the narrow-line excess objects in the FDF (shown is a deep I-band image). Circles correspond to objects found in the narrow-band F810, triangles to objects detected in the narrow-band F815, and crosses to objects found in the narrow-band F823. North is up, east is left. The field is
|
| Open with DEXTER | |
In the text
![\begin{figure}
\includegraphics[width=6cm,angle=-90]{4872fi4.ps}
\end{figure}](/articles/aa/full/2006/31/aa4872-06/img37.gif) |
Figure 4: Distribution of redshifts of the eight LAE candidates observed spectroscopically. |
| Open with DEXTER | |
In the text
![\begin{figure}
\includegraphics[width=6cm,angle=-90]{4872fi5.ps}
\end{figure}](/articles/aa/full/2006/31/aa4872-06/img38.gif) |
Figure 5: The distribution of the photometric line fluxes of the 15 LAE candidates. |
| Open with DEXTER | |
In the text
![\begin{figure}
\includegraphics[width=6cm,angle=-90]{4872fi6.ps}
\end{figure}](/articles/aa/full/2006/31/aa4872-06/img39.gif) |
Figure 6: The distribution of the star-formation rates derived from the photometric line fluxes. |
| Open with DEXTER | |
In the text
![\begin{figure}
\resizebox{8.8cm}{!}{\includegraphics[clip=true]{4872fi7.ps}}
\end{figure}](/articles/aa/full/2006/31/aa4872-06/img52.gif) |
Figure 7: Composite spectra of the eight emission line objects. The dotted line is the instrumental profile, derived from the sky lines. |
| Open with DEXTER | |
In the text
![\begin{figure}
\resizebox{8.8cm}{!}{\includegraphics[angle=-90]{4872fi8.ps}}
\end{figure}](/articles/aa/full/2006/31/aa4872-06/img53.gif) |
Figure 8:
Luminosity function derived from the photometric data (filled
squares). Two surveys at a redshift of z = 5.7 have been included: circles
correspond to the 19 spectroscopically confirmed candidates of Hu et al. (2004) and open squares to Ajiki et al. (2003). Two surveys at a redshift of
|
| Open with DEXTER | |
In the text
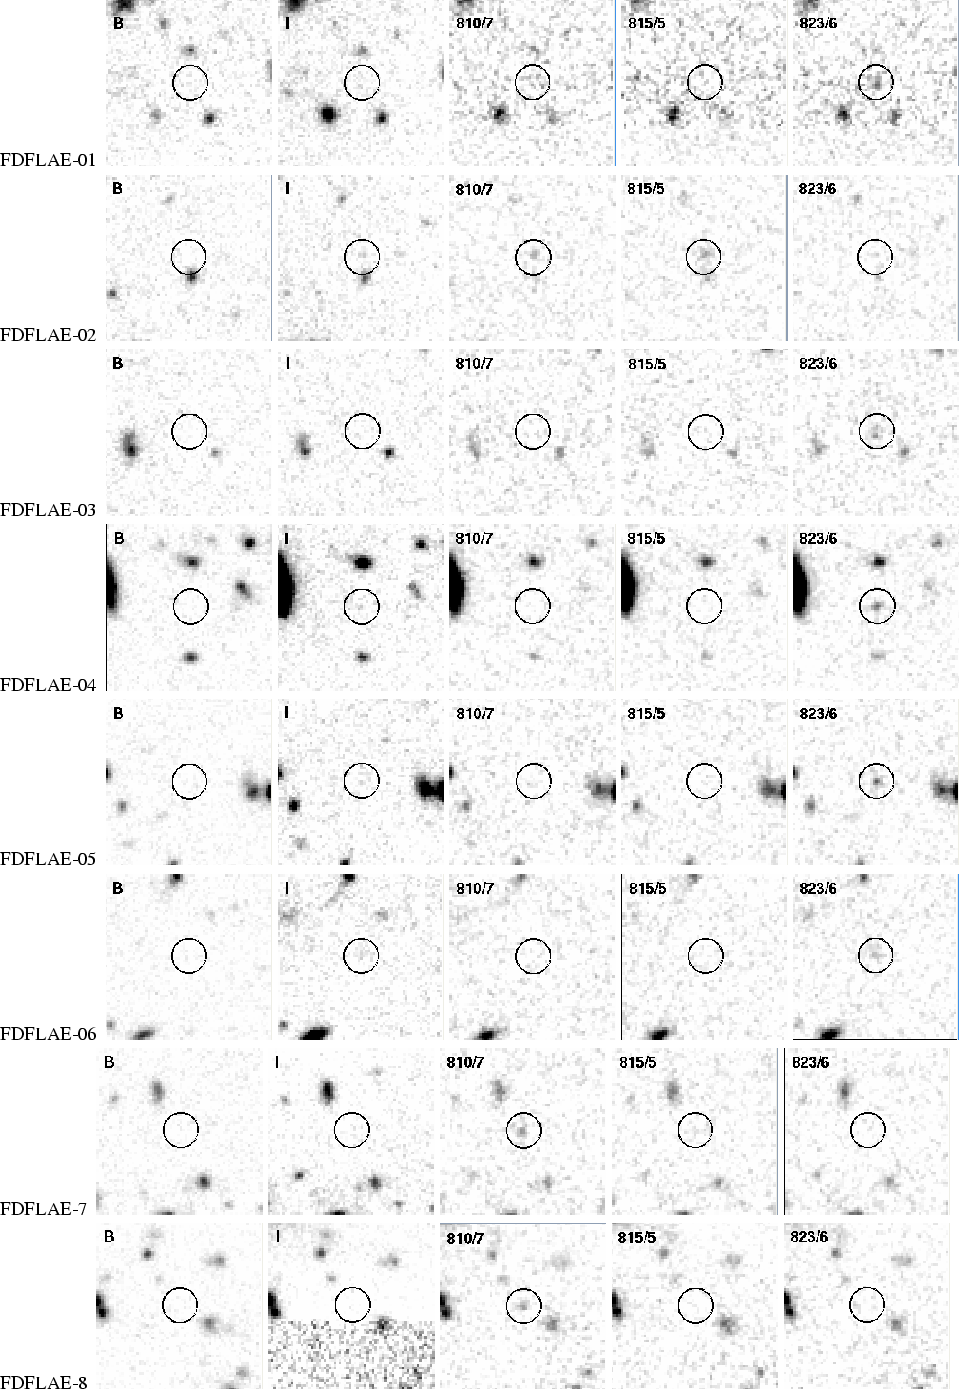 |
Figure 9:
From left to right: B, I, and narrow-band
(810/7, 815/5, 823/6) thumbnail images of Ly- |
| Open with DEXTER | |
In the text
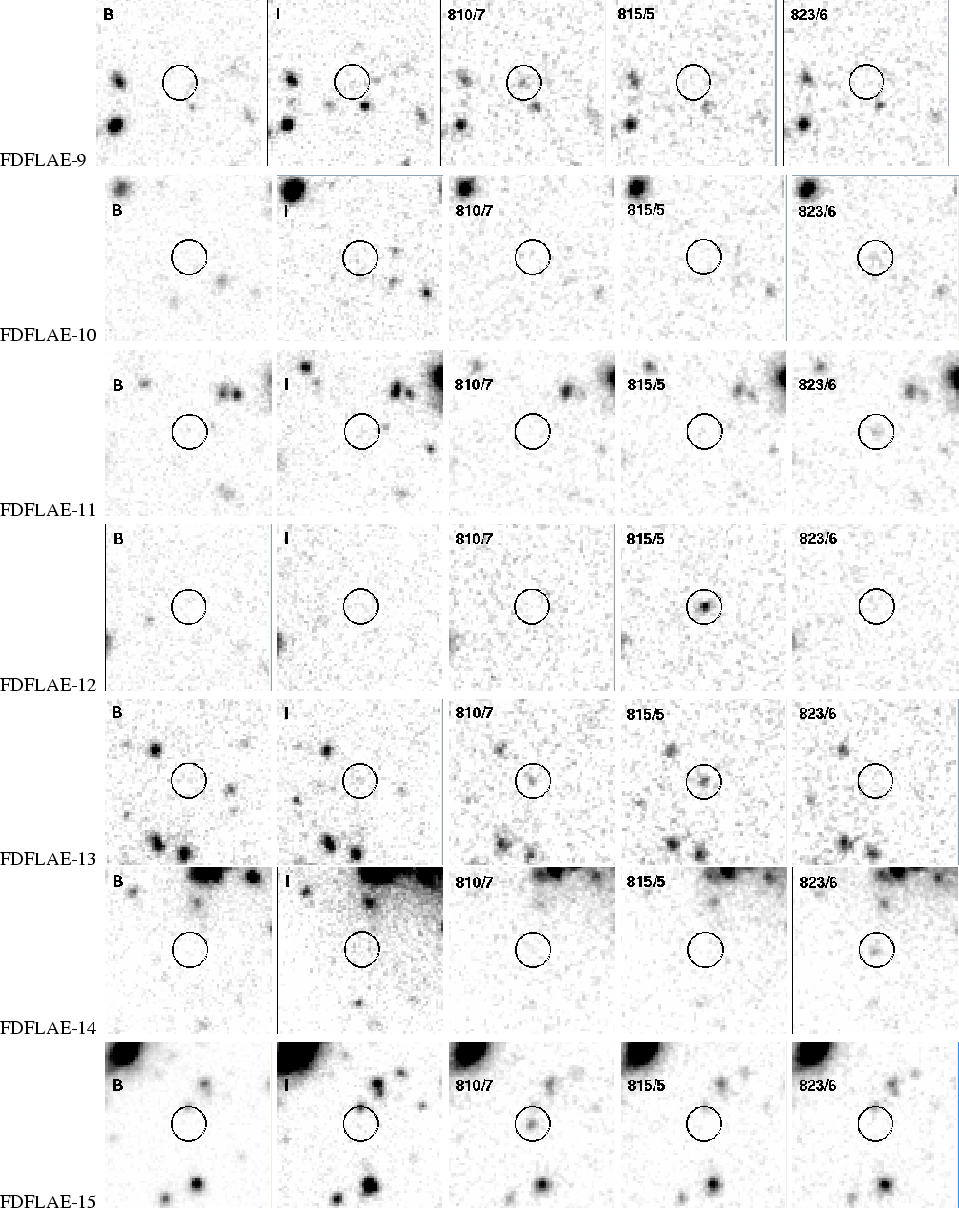 |
Figure 9:
continued. From left to right: B, I, and narrow-band
(810/7, 815/5, 823/6) thumbnail images of Ly- |
| Open with DEXTER | |
In the text