 |
Figure 1:
Diagnostic diagram [O III] |
| Open with DEXTER | |
In the text
 |
Figure 2: Difference between ionic abundances calculated with the new and old emissivities in the case of the low-density limit as a function of the electron temperature. Curves are labeled by the emission lines used for the abundance determination. |
| Open with DEXTER | |
In the text
 |
Figure 3:
Relations between the electron temperatures a)
|
| Open with DEXTER | |
In the text
 |
Figure 4:
a) Relation between the electron temperatures
|
| Open with DEXTER | |
In the text
 |
Figure 5: Ionization correction factor ICF(S++S2+) vs. the fraction O+/(O++O2+) for the "low Z'' models with different rates of dielectronic recombination for sulfur ions. Nominal dielectronic recombination for sulfur ions is the same as that for oxygen ions. |
| Open with DEXTER | |
In the text
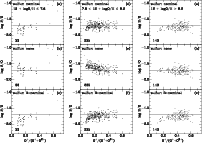 |
Figure 6:
Left: sulfur-to-oxygen abundance ratio vs. the fraction
O+/(O++O2+) in the H II regions with 12 + log O/H |
| Open with DEXTER | |
In the text
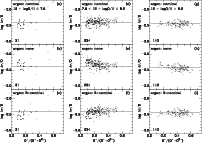 |
Figure 7: The same as in Fig. 6 but for argon. Nominal dielectronic recombination for Ar ions is the same as that for Ne ions. |
| Open with DEXTER | |
In the text
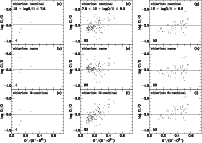 |
Figure 8: The same as in Fig. 6 but for chlorine. Nominal dielectronic recombination for Cl ions is the same as that for O ions. |
| Open with DEXTER | |
In the text
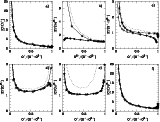 |
Figure 9:
Ionization correction factors for heavy elements.
Filled circles are for the models
with Z = 0.02 |
| Open with DEXTER | |
In the text
![\begin{figure}
\par {\includegraphics[angle=0,width=8.5cm]{3763f10a.ps}\hspace*{...
...\includegraphics[angle=0,width=8.5cm]{3763f10c.ps}\hspace*{4.5cm}}\end{figure}](/articles/aa/full/2006/12/aa3763-05/Timg114.gif) |
Figure 10: SDSS spectra of the H II regions listed in Table 3. The names of the spectra in the SDSS database are shown in parentheses. |
| Open with DEXTER | |
In the text
![\begin{figure}
\par\mbox{\includegraphics[angle=0,height=10.5cm]{3763f11a.ps}\includegraphics[angle=0,height=10.5cm]{3763f11b.ps} }
\end{figure}](/articles/aa/full/2006/12/aa3763-05/Timg115.gif) |
Figure 11: log N/O a), g), log Ne/O b), h), log S/O c), i), log Cl/O d), j), log Ar/O e), k) and log Fe/O f), l) vs. oxygen abundance 12 + log O/H for the emission-line galaxies. Large filled circles are galaxies from the HeBCD sample, dots are galaxies from the SDSS sample. Abundances in the left panel are calculated with the expressions used by Izotov et al. (1997,1994) and Thuan et al. (1995) and those in the right panel are obtained with expressions from this paper. The solar values as compiled by Lodders (2003) are indicated by the large open circles and the associated error bars are shown. Straight lines are linear regressions obtained for the HeBCD sample. |
| Open with DEXTER | |
In the text
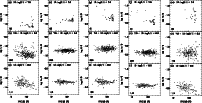 |
Figure 12:
a)-c) Nitrogen-to-oxygen abundance ratio, log N/O,
vs. equivalent width
of H |
| Open with DEXTER | |
In the text