 |
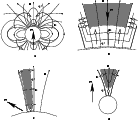
Figure 1:
Sketch of
various models for pair creation (hatched) on the open field lines
|
| Open with DEXTER | |
In the text
| |
Figure 2:
The
current system I in the axially symmetric case; magnetic field
|
| Open with DEXTER | |
In the text
![\begin{figure}
\par\includegraphics[width=7.5cm,clip]{3040f3.eps}\end{figure}](/articles/aa/full/2006/03/aa3040-05/Timg61.gif) |
Figure 3:
Level curves of the electrostatic potential |
| Open with DEXTER | |
In the text
![\begin{figure}
\mbox{
\includegraphics[width=4.3cm]{3040f4a.eps}\hskip0.3cm
\inc...
...040f4d.eps}\hskip0.3cm
\includegraphics[width=4.3cm]{3040f4e.eps} }
\end{figure}](/articles/aa/full/2006/03/aa3040-05/Timg68.gif) |
Figure 4:
Axially symmetric case: Sketch of the level curves of the electrostatic
potential |
| Open with DEXTER | |
In the text
 |
Figure 5:
Top:
model for the hollow beam. The density difference between
positrons and electrons is
|
| Open with DEXTER | |
In the text
| |
Figure 6:
Similar to
Fig. 5; now, a core component is included. The
dimensionless charge difference in Region I is |
| Open with DEXTER | |
In the text
 |
Figure 7: Similar to Fig. 5, but now, part of the beam moves in the opposite direction (Rp is defined by Eq. (19)). |
| Open with DEXTER | |
In the text
![\begin{figure}
\par\includegraphics[width=7.1cm,clip]{3040f8.eps}\end{figure}](/articles/aa/full/2006/03/aa3040-05/Timg136.gif) |
Figure 8: Examples of equilibrium rotational velocity distributions across the beam, where R1,R2 are the inner and outer boundary of the beam. See text for the cases and the beam parameters. |
| Open with DEXTER | |
In the text
![\begin{figure}
\par\includegraphics[width=7cm,clip]{3040f9.eps}\end{figure}](/articles/aa/full/2006/03/aa3040-05/Timg180.gif) |
Figure 9:
Equipotential for annular beam with Q = 0, R1 = 0.5,
R2 = 0.6 and l = 5 at t = 0. Black areas denote negatively
valued |
| Open with DEXTER | |
In the text
![\begin{figure}
\mbox{%
\par\includegraphics[width=5.6cm]{3040f10a.eps}\hskip1.7c...
...10e.eps}\hskip1.7cm
\includegraphics[width=5.6cm]{3040f10f.eps}\\ }
\end{figure}](/articles/aa/full/2006/03/aa3040-05/Timg186.gif) |
Figure 10:
Left: unstable diocotron modes in the parameter
space of R1/R3 (along the horizontal axis) and R2/R3(along the vertical axis). In levels of grey is plotted
|
| Open with DEXTER | |
In the text
![\begin{figure}
\mbox{%
\par\includegraphics[width=5.6cm]{3040f11a.eps}\hskip1.7c...
...11e.eps}\hskip1.7cm
\includegraphics[width=5.6cm]{3040f11f.eps}\\ }
\end{figure}](/articles/aa/full/2006/03/aa3040-05/Timg188.gif) |
Figure 11:
The same as in Fig. 10, but now including
a charge-separated core in Region I (see Eq. (25) and
Fig. 6). The corresponding value of
|
| Open with DEXTER | |
In the text
![\begin{figure}
\mbox{%
\par\includegraphics[width=5.6cm]{3040f12a.eps}\hskip2cm
...
...040f12c.eps}\hskip2cm
\includegraphics[width=5.6cm]{3040f12d.eps} }
\end{figure}](/articles/aa/full/2006/03/aa3040-05/Timg189.gif) |
Figure 12: The same as in the left column of Fig. 10, but now including a return current (see Eq. (26) and Fig. 7). Above each graph are seen the corresponding parameters Q and p, the latter defining Rp, i.e. the radius where the axial velocity of the beam particles changes sign (see Eq. (19)). |
| Open with DEXTER | |
In the text
![\begin{figure}
\mbox{%
\par\includegraphics[width=5.6cm]{3040f13a.eps}\hskip2cm
...
...040f13c.eps}\hskip2cm
\includegraphics[width=5.6cm]{3040f13d.eps} }
\end{figure}](/articles/aa/full/2006/03/aa3040-05/Timg190.gif) |
Figure 13: Maximum growth rate (squares) and pattern velocities (triangles) corresponding to the case in Fig. 12. |
| Open with DEXTER | |
In the text
![\begin{figure}
\par\includegraphics[width=8.1cm,clip]{3040f14.eps}\end{figure}](/articles/aa/full/2006/03/aa3040-05/Timg218.gif) |
Figure 14: Growth rates as functions of Q, for different values of azimuthal mode number l (indicated in the plot), for a hollow beam with R1/R3 = 0.65 and R2/R3 = 0.92. |
| Open with DEXTER | |
In the text
![\begin{figure}
\mbox{
\includegraphics[width=5.4cm]{3040f15a.eps}\hskip1.7cm
\in...
...0f15c.eps}\hskip1.7cm
\includegraphics[width=5.4cm]{3040f15d.eps} }
\end{figure}](/articles/aa/full/2006/03/aa3040-05/Timg221.gif) |
Figure 15: Similar to Fig. 14, but now for different combinations of the inner and outer radii of the beam. Top: R1/R3 = 0.6 ( left) and R1/R3 = 0.8 ( right). Bottom: R2/R3 = 0.86 ( left) and R2/R3 = 0.93 ( right). |
| Open with DEXTER | |
In the text
![\begin{figure}
\par\includegraphics[width=14.8cm,clip]{3040f16.eps}\end{figure}](/articles/aa/full/2006/03/aa3040-05/Timg242.gif) |
Figure 16:
Domain of instability for l=13 as applied to
PSR B0826-10. The three regions denote different intervals of
|
| Open with DEXTER | |
In the text