![\begin{figure}
\par\includegraphics[width=12.5cm,clip]{2193fig1.ps}
\end{figure}](/articles/aa/full/2005/48/aa2193-04/Timg21.gif) |
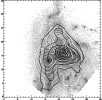
Figure 1:
A deconvolved ISOCAM 14.3 |
| Open with DEXTER | |
In the text
![\begin{figure}
\par\includegraphics[width=15cm,clip]{2193fig2.eps}
\end{figure}](/articles/aa/full/2005/48/aa2193-04/Timg23.gif) |
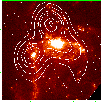
Figure 2:
Deconvolved ISOCAM contour maps overlaid on the HST image:
i) 6.7 |
| Open with DEXTER | |
In the text
 |
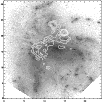
Figure 3:
An overlay of the ISO 15 |
| Open with DEXTER | |
In the text
 |
Figure 4:
The 14.3/6.7 um ratio map overlaid on the HST image of Mkn 297. Deconvolved
6.7 and 14.3 |
| Open with DEXTER | |
In the text
![\begin{figure}
\par\includegraphics[width=8.8cm,clip]{2193fig5.eps}
\end{figure}](/articles/aa/full/2005/48/aa2193-04/Timg26.gif) |
Figure 5: PHT-SL spectrum of Mkn 297, with the PHT-S aperture centred 3'' East of the nucleus of galaxy A. The PAH features are indicated. The spectrum has been Hanning smoothed. The flux levels are those recorded in the PHT-S aperture, before scaling to the larger ISOCAM field-of-view (see Sect. 2.4). |
| Open with DEXTER | |
In the text
 |
Figure 6:
LWS spectra of a) the [OI] line at 63.1 |
| Open with DEXTER | |
In the text
![\begin{figure}
\par {\includegraphics[width=8.5cm,clip]{2193fig7.ps} }
\end{figure}](/articles/aa/full/2005/48/aa2193-04/Timg28.gif) |
Figure 7:
Spectral energy distribution of Mkn 297 using
ISO and IRAS flux data, including the key for the different
symbols. The PHT-S spectrum has been normalised to the CAM
7.7 |
| Open with DEXTER | |
In the text
 |
Figure 8: An overlay of the Yin (1994) 6 cm radio contours on the HST image of Mkn 297. |
| Open with DEXTER | |
In the text