 |
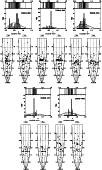
Figure 1:
For each cluster the obtained redshifts ( upper panels) and
the redshifts as function of right ascension and declination ( lower
panels, left and right) are shown. In the upper panel the upper part
gives a bar diagram of the redshifts, while the lower part gives the
redshift distribution (dashed line) with the identified groups (solid
line). In the lower panels the left cone shows the redshifts as
function of right ascension and the right one the redshifts as function
of declination. The diagrams correspond to the complete coverage of
each field. The bar in the top of each cone gives the scale of
|
| Open with DEXTER | |
In the text
 |
Figure 2:
A
|
| Open with DEXTER | |
In the text
 |
Figure 3:
A
|
| Open with DEXTER | |
In the text
 |
Figure 4:
A
|
| Open with DEXTER | |
In the text
 |
Figure 5:
A
|
| Open with DEXTER | |
In the text
 |
Figure 6:
A
|
| Open with DEXTER | |
In the text