![\begin{figure}
\par\includegraphics[width=7.8cm,clip]{2869fig2.ps}\end{figure}](/articles/aa/full/2005/40/aa2869-05/Timg31.gif) |
Figure 2: Detailed spectrum showing the region centered at 6828 Å. The histogram is the observed spectrum. The dotted-dashed line represents a two-Gaussian fit, with the narrow and broad components represented by dotted and dashed lines respectively. The broad feature redwards of the [Kr III] line is identified as the O VI Raman line (see text). |
| Open with DEXTER | |
In the text
![\begin{figure}
\par\includegraphics[width=7.7cm,clip]{2869fig3.ps}\end{figure}](/articles/aa/full/2005/40/aa2869-05/Timg49.gif) |
Figure 3:
The UV and optical spectrum showing the 2200 Å extinction
bump which
can be used to estimate total reddening towards NGC 7027. The solid and dotted
lines show respectively the observed spectrum and that dereddened assuming
|
| Open with DEXTER | |
In the text
![\begin{figure}
\par\includegraphics[width=7.2cm,clip]{2869fig4}\end{figure}](/articles/aa/full/2005/40/aa2869-05/Timg61.gif) |
Figure 4: Plasma diagnostic diagram. Each curve is labelled with an ID number given in Table 5. |
| Open with DEXTER | |
In the text
![\begin{figure}
\par\includegraphics[width=7.5cm,clip]{2869fig5.ps}\end{figure}](/articles/aa/full/2005/40/aa2869-05/Timg86.gif) |
Figure 5:
The He I
|
| Open with DEXTER | |
In the text
![\begin{figure}
\par\includegraphics[width=16cm,clip]{2869fig6.ps}\end{figure}](/articles/aa/full/2005/40/aa2869-05/Timg96.gif) |
Figure 6:
Intensity ratios of a) H I Balmer lines to H 11 |
| Open with DEXTER | |
In the text
![\begin{figure}
\par\includegraphics[width=8.8cm,clip]{2869fig7.ps}\end{figure}](/articles/aa/full/2005/40/aa2869-05/Timg287.gif) |
Figure 7: Comparison of C, N, O and Ne ionic abundances derived from ORLs with those from UV, optical and IR CELs. |
| Open with DEXTER | |
In the text
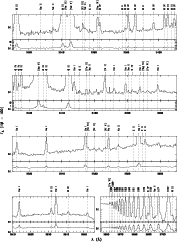 |
Figure 1: Optical spectrum of NGC 7027. A `+' attached to a line identification means that the line is blended with other emission features. |
| Open with DEXTER | |
In the text
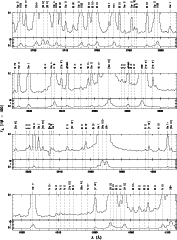 |
Figure 1: continued. |
| Open with DEXTER | |
In the text
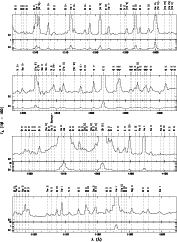 |
Figure 1: continued. |
| Open with DEXTER | |
In the text
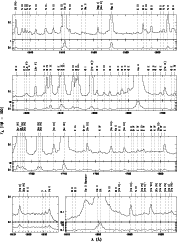 |
Figure 1: continued. |
| Open with DEXTER | |
In the text
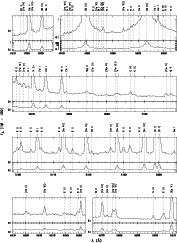 |
Figure 1: continued. |
| Open with DEXTER | |
In the text
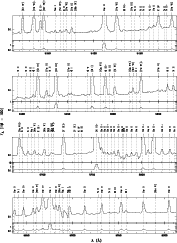 |
Figure 1: continued. |
| Open with DEXTER | |
In the text
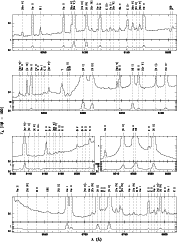 |
Figure 1: continued. |
| Open with DEXTER | |
In the text
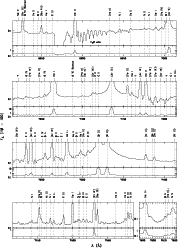 |
Figure 1: continued. |
| Open with DEXTER | |
In the text
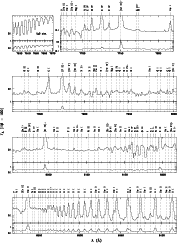 |
Figure 1: continued. |
| Open with DEXTER | |
In the text
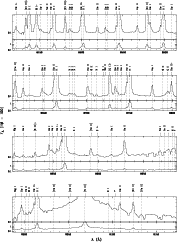 |
Figure 1: continued. |
| Open with DEXTER | |
In the text