![\begin{figure}
\par\resizebox{13.8cm}{!}{\includegraphics[clip]{3347fig1.eps}}
\end{figure}](/articles/aa/full/2005/37/aa3347-05/Timg58.gif) |
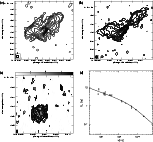
Figure 1:
Images and spectrum for 0222+36. a) VLA at 8.4 GHz, b) VLA at 22.5 GHz, c) VLBA at 1.6 GHz, d) spectrum. Contours are traced at (1, 2, 4, ...) times the |
| Open with DEXTER | |
In the text
 |
Figure 2:
Image of 0222+36 at 5 GHz, VLA in "A+B'' configuration. Contours are traced at (1, 2, 4, 8, ...) times the |
| Open with DEXTER | |
In the text
 |
Figure 3: Spectra for the three components of 0222+36: a) core, b) lobes, c) halo. The solid lines are fits with a model of continuous injection and low frequency self-absorption. The spectral points and the parameters resulting from the fits are presented in Table 7. |
| Open with DEXTER | |
In the text
 |
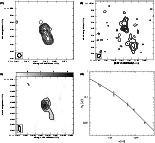
Figure 4:
Images and spectrum for 0258+35. a) VLA at 8.4 GHz, b) VLA at 22.5 GHz, c) VLBA at 1.6 GHz, d) spectrum. Contours are traced at (1, 2, 4, ...) times the |
| Open with DEXTER | |
In the text
 |
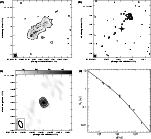
Figure 5:
Images and spectrum for 0648+27. a) VLA at 8.4 GHz, b) VLA at 22.5 GHz, c) VLBA at 1.6 GHz, d) spectrum. Contours are traced at (1, 2, 4, ...) times the |
| Open with DEXTER | |
In the text
 |
Figure 6:
Images and spectrum for 1037+30. a) VLA at 8.4 GHz (grey scale between 0.1 and 10 mJy/beam), b) VLA at 22.5 GHz, c) VLBA at 1.6 GHz, d) spectrum. Contours are traced at (1, 2, 4, ...) times the |
| Open with DEXTER | |
In the text
 |
Figure 7:
Phase referenced VLBA image of the hot spot region of 1037+30. Contours are traced at (1, 2, 4, 8, ...) times the |
| Open with DEXTER | |
In the text
 |
Figure 8:
The VLA image and spectrum for 1855+37. a) VLA at 8.4 GHz, b) spectrum. Contours are traced at (1, 2, 4, ...) times the |
| Open with DEXTER | |
In the text
 |
Figure 9: Radio power vs. linear size diagram for sources in the Bologna Complete Sample (BCS, Giovannini et al. 2005). The filled squares indicate sources studied in the present work, while the starred symbols are for the two other compact sources in the sample: 0116+31 (4C 31.04, Giroletti et al. 2003) and 1217+29 (NGC 4278, Giroletti et al. 2005) |
| Open with DEXTER | |
In the text