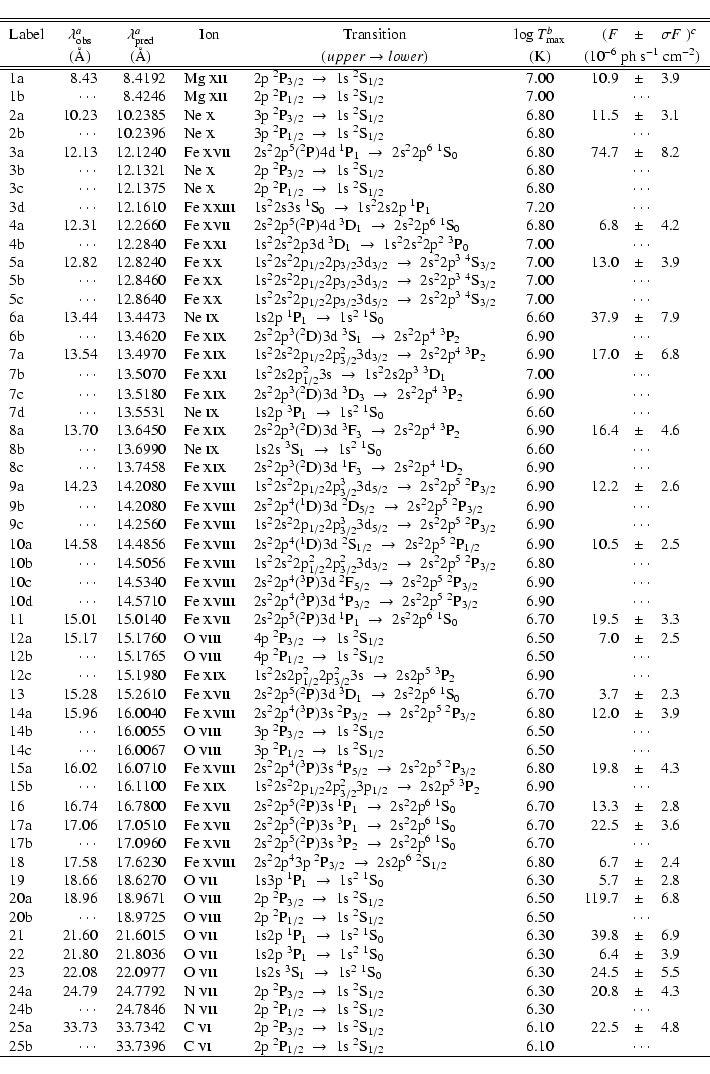
Table A.1:
Strongest RGS lines of TWA 5.
- a
- Observed and predicted (APED database) wavelengths. In the cases of unresolved blends identified by the same label number, we list the main components in order of increasing predicted wavelength.
- b
- Temperature of maximum emissivity.
- c
- Line fluxes with uncertainties at the 68% confidence level obtained by fitting RGS1 and RGS2 spectra simultaneously. In the cases of unresolved blends identified by the same label number, we report only the total flux of the blended lines.
|
Source LaTeX |
All tables |
In the text