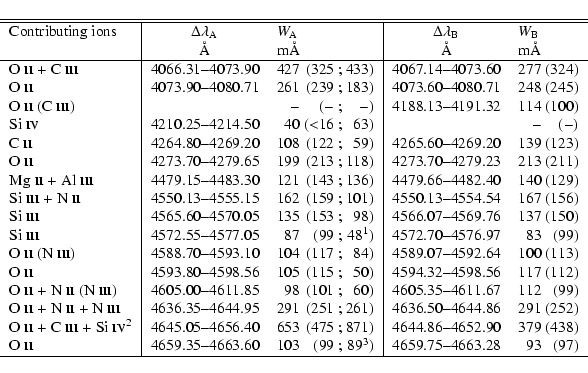
Table 1:
Spectral features used in the abundance analysis.
Main contributing ions are indicated. For each binary component, the
equivalent width W of all the absorption over the spectral interval
specified in Cols. 2 and 4 is given in Cols. 3 and 5. The values
between brackets are the corresponding W measured in the #201 spectrum
blurred to the rotation velocity of component A resp. B (and in #180,
behind the semicolon in the fourth column).
Notes:
1 With contribution from weak, unidentified line at  4573.2. 4573.2.
2 Only in the
 interval.
3 Weak C III lines at edges of interval contribute partly.
|
Source LaTeX |
All tables |
In the text