![\begin{figure}
\par\includegraphics[width=8.8cm,clip]{F1_finf1.eps}\end{figure}](/articles/aa/full/2005/19/aa2239/img55.gif) |
Figure 1: Application of spectrum deconvolution (sLSD) to the "6400 Å'' wavelength region of two spectra of BO Mic. In the large panels the gray broad-lined curve represents the observed spectrum, the black spectrum shows the fit by sLSD. The narrow-lined spectrum is the template used for deconvolution (a synthetic PHOENIX 5200 K spectrum without rotational broadening). The inset panels show the resulting line profiles (broadening functions), their x-axes are annotated in units of 120 km s-1. The lowermost panel shows the "continuum correction function'' (CCF) used for both spectra; see text for details. |
| Open with DEXTER | |
In the text
![\begin{figure}
\includegraphics[width=8.8cm,clip]{F1_finf2.eps}\par\end{figure}](/articles/aa/full/2005/19/aa2239/img56.gif) |
Figure 2: Application of sLSD to the "6120 Å'' wavelength region; the input spectra are the same as in Fig. 1, observed on 2002 August 2 at rotation phases 0.337 and 0.639, respectively. For this wavelength range an observed template spectrum (Gl 472) was used. |
| Open with DEXTER | |
In the text
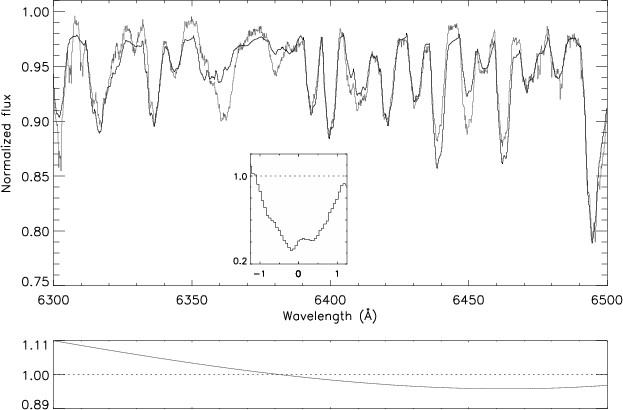 |
Figure 3: Application of sLSD to a moderately wide spectral range around the "6400 Å'' wavelength region. The input and template spectra are the same as in the lower panel of Fig. 1, the latter is not shown here. The reasons for the rather poor fit to the spectrum are discussed in the text. |
| Open with DEXTER | |
In the text
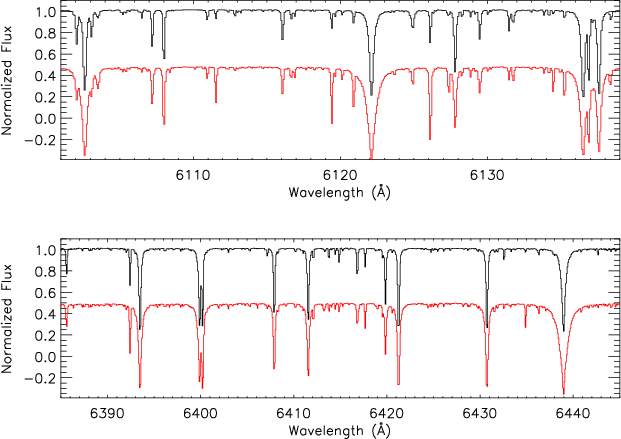 |
Figure 4: Selected ranges from synthetic spectra, not rotationally broadened. The PHOENIX 5200 K spectrum (black) has been used as the template spectrum for applying sLSD to the "6400 Å'' wavelength range. The PHOENIX 4600 K spectrum (red/gray) is considered as a proxy for the spectrum of the spots on BO Mic, see text for details. For both panels, the quasi-continua have been normalized to unity, the red/gray spectrum is shifted in flux by -0.5. |
| Open with DEXTER | |
In the text
 |
Figure 5:
Upper panel:
average line profile of BO Mic (stepped graph)
extracted by sLSD from the
"6400 Å''
wavelength region;
the radial velocity is annotated in units of 120 km s-1.
The smooth graph shows a fitted analytical rotation profile,
its parameters are given in Table 1.
Lower panel:
correction function |
| Open with DEXTER | |
In the text
![\begin{figure}
\par\includegraphics[width=17cm,clip]{2239aa_SM_DI_final_p10.eps}\end{figure}](/articles/aa/full/2005/19/aa2239/img74.gif) |
Figure 6:
Doppler images of BO Mic, reconstructed by CLDI
from the wavelength region given above each panel.
The lower and upper map of each panel show the same surface, but rotated by 180 degrees.
Black and dark gray/orange areas represent surface regions completely covered or
50% covered with spots, respectively. Unspotted regions are rendered as light shades.
The subobserver longitudes of the observed phases are marked by short lines.
A rotation phase |
| Open with DEXTER | |
In the text
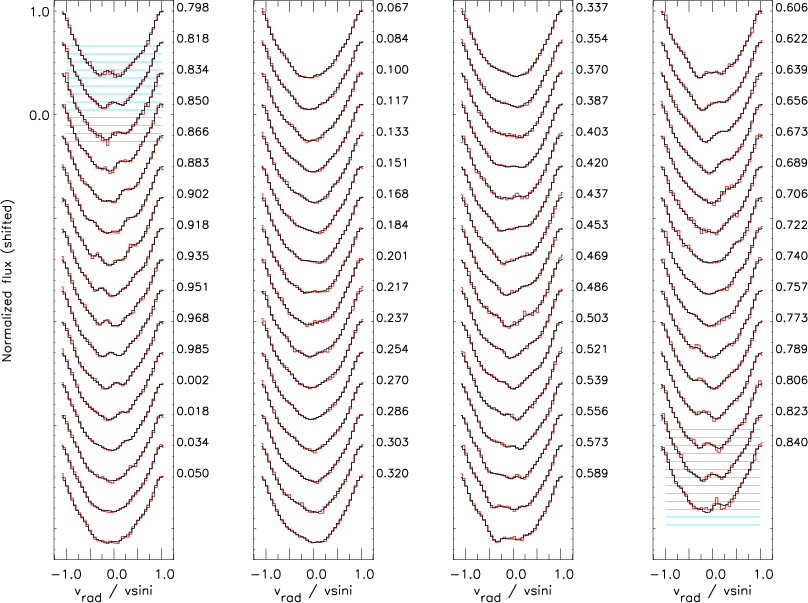 |
Figure 7:
Line profiles of BO Mic, extracted by spectrum deconvolution in the "6400 Å''-region (red/gray)
and fitted by CLDI (black).
The reconstruction parameters are listed in Table 1.
Subsequent profiles of the time series are shifted,
the flux scale is valid for the topmost profile of each panel.
The rotation phases
are given right of each profile,
with the phase zero-point at
|
| Open with DEXTER | |
In the text
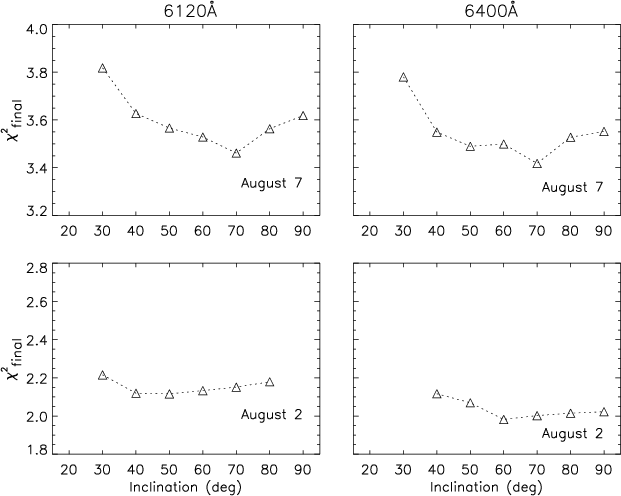 |
Figure 8:
Quality of line profile fits
|
| Open with DEXTER | |
In the text
![\begin{figure}
\par\includegraphics[width=8cm,clip=]{239_09.ps} \par\end{figure}](/articles/aa/full/2005/19/aa2239/img88.gif) |
Figure 9:
Quantifying the Doppler image resolution:
cross-correlation of different-wavelength Doppler images reconstructed from the
same input spectra (2004 August 2, i.e. the
upper maps of Fig. 6).
The left panel shows the cross-correlation of corresponding latitude strips of the compared maps;
darker shades represent larger values.
The relative maximum on each colatitude (
|
| Open with DEXTER | |
In the text
![\begin{figure}
\includegraphics[width=8.8cm,clip=]{239_10.eps} \end{figure}](/articles/aa/full/2005/19/aa2239/img95.gif) |
Figure 10:
Lightcurves computed from Doppler images of the "6400 Å'' wavelength region.
The symbols represent the August 2 ( |
| Open with DEXTER | |
In the text
![\begin{figure}
\includegraphics[width=8.8cm,clip=]{239_11.eps}\par\end{figure}](/articles/aa/full/2005/19/aa2239/img96.gif) |
Figure 11:
Lightcurve of BO Mic (2002 August 3-5), folded with a period of 0.380 days.
Note that this folding period does not merge any portion of the data observed
during different nights into a unique lightcurve.
Annotation dates are JD-2 440 000:
+ = August 3, |
| Open with DEXTER | |
In the text
![\begin{figure}
\includegraphics[width=8cm,clip=]{239_12.ps} %
\par\end{figure}](/articles/aa/full/2005/19/aa2239/img97.gif) |
Figure 12:
Cross-correlation of the August 2 and August 7 Doppler images of BO Mic,
reconstructed from the "6400 Å'' wavelength region
(right column maps of Fig. 6).
The compared images have been smoothed by a two-dimensional boxcar extending
10 |
| Open with DEXTER | |
In the text
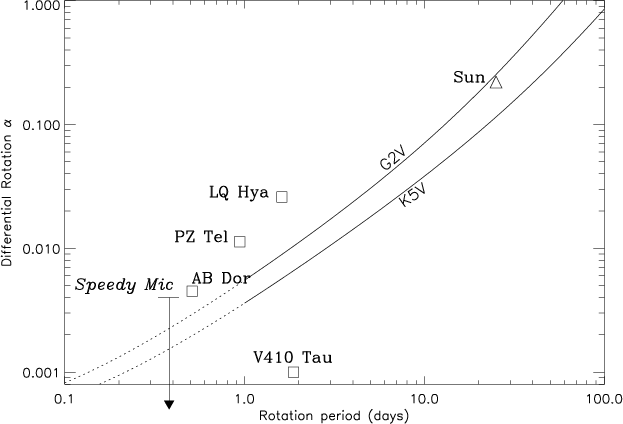 |
Figure 13:
Theory and measurements of differential rotation of (apparently) single dwarf stars.
The curves are adapted from Kitchatinov & Rüdiger (1999) and extrapolated below a period of one day.
Squares mark measurements
based on comparisons of Doppler images
(Rice & Strassmeier 1996; Donati et al. 1999,2003; Barnes et al. 2000)
or the related
method of "direct spot tracking'' (Collier Cameron et al. 2002).
The upper limit
determined for BO Mic (Speedy Mic) in this
work is rendered by
the arrow's top. The arrowhead drawn outside the plot
illustrates the possibility of anti-solar differential rotation
(i.e. the equator rotating slower than the poles in terms of |
| Open with DEXTER | |
In the text