![\begin{figure}
\par\includegraphics[width=13cm,clip]{1028fig1.eps} \end{figure}](/articles/aa/full/2005/14/aa1028/Timg23.gif) |
Figure 1:
Three-color image of NGC 5253 in the V band (blue), I band
(green) and Ks band (red). North is up and east is right. The image is
|
| Open with DEXTER | |
In the text
![\begin{figure}
\par\includegraphics[width=8cm,clip]{1028fig2.ps} %
\end{figure}](/articles/aa/full/2005/14/aa1028/Timg34.gif) |
Figure 2:
Color-color plot of the observed clusters in NGC 5253.
Upper panel: the circles are the clusters detected in all all bands
(V, I, and Ks), the filled ones with a mean of the uncertainties in the two
colors of less than 0.2 mag and the open ones with errors between 0.2 and 0.44 mag.
The solid line is the SB99 model of an instantaneous burst
of star formation, with Z=0.004, assuming a Salpeter IMF with
|
| Open with DEXTER | |
In the text
 |
Figure 3: Spatial distribution of older (gray circles, age > 20 Myr) and younger (white rectangles, age < 20 Myr) matched clusters, compared with the VLT Ks band image. |
| Open with DEXTER | |
In the text
 |
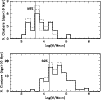
Figure 4: The luminosity function of the sources observed in V and Ks band. The solid line is the observed function, and the dotted one is after correction for extinction. The dashed line is the completeness-corrected function, where the correction is applied to the 50% completeness limit. The Gaussian curves are the best fit to the observed distributions. |
| Open with DEXTER | |
In the text
 |
Figure 5:
Mass function of the young clusters detected in H |
| Open with DEXTER | |
In the text