![\begin{figure}{\includegraphics[height=8.5cm, angle=-90]{1729fig1.eps} }
\end{figure}](/articles/aa/full/2005/10/aa1729/Timg52.gif) |
Figure 1:
Predicted CO line intensities, using different sets of calculated
collisional rate coefficients, for an isothermal homogeneous sphere with
a kinetic temperature 10 K, a H2 density of 103 cm-3 and a CO
column density of
|
| Open with DEXTER | |
In the text
![\begin{figure}{\includegraphics[width=16cm]{1729fig2.eps} }
\end{figure}](/articles/aa/full/2005/10/aa1729/Timg58.gif) |
Figure 2: Calculated and extrapolated collisional de-excitation rate coefficients for CO in collisions with para-H2. Open triangles indicate extrapolation in temperature to the rate coefficients of Flower & Launay (1985) (filled triangles). Open squares show the extrapolation to higher temperatures and energy levels of the recent rate coefficients calculated by Flower (2001a) (filled squares). For comparison the rate coefficients presented by Schinke et al. (1985) (filled circles) and the extrapolation performed by Larsson et al. (2002) (filled stars) are shown. |
| Open with DEXTER | |
In the text
![\begin{figure}{\includegraphics[height=8cm,angle=-90]{1729fig3.eps} }
\end{figure}](/articles/aa/full/2005/10/aa1729/Timg72.gif) |
Figure 3:
The solid lines are fits to the CO-p-H2 collisional rate coefficients from
Flower (2001a) (squares ) for transitions down to the ground state from upper
energy levels
|
| Open with DEXTER | |
In the text
 |
Figure 4: Collisional de-excitation rate coefficients for the lowest 50 states of SO2 summed over all lower levels, calculated from the data by Green (1995) for various temperatures. |
| Open with DEXTER | |
In the text
 |
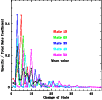
Figure 5: State-to-state de-excitation rate coefficients for SO2 as fractions of the total downward rate coefficient (Fig. 4), as a function of the number of levels by which the transition is changed. The light (coloured) curves are values from Green (1995) at T=25 K for the 10th, 20th, 30th, 40th and 50th state above ground. The thick black curve is the normalized mean of the light (coloured) curves, adopted here to extrapolate Green's rate coefficients to higher-lying levels. The states are labelled in order of increasing energy. |
| Open with DEXTER | |
In the text