 |
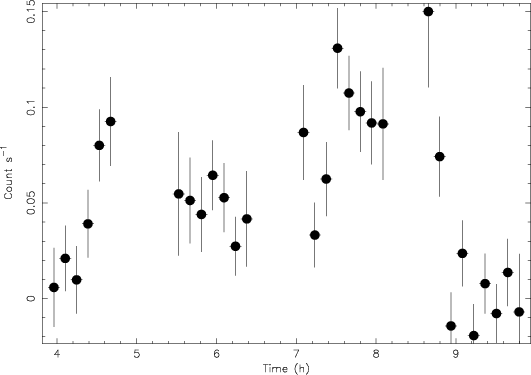
Figure 1: Background subtracted light curve obtained from the sum of the two GIS instruments during the 1997 observation. Time is in hours from the beginning of the observation (3 Sep. 1997, 03:01:20). Bin size is 512 s. The source is variable and goes below the threshold of detectability at the beginning and at the end of the observation. |
| Open with DEXTER | |
In the text
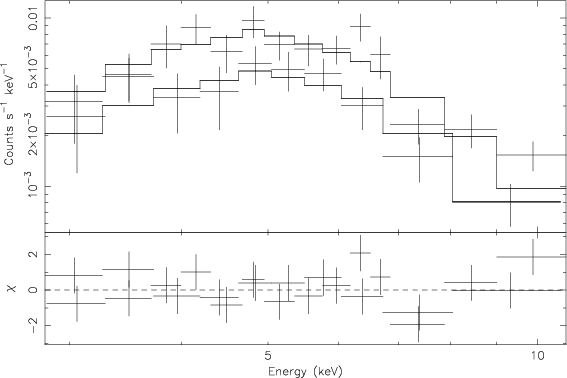 |
Figure 2: Best fit power law spectrum of AX J161929-4945 obtained with the GIS2 and GIS3 instruments. The residuals in units of standard deviations are shown in the lower panel. |
| Open with DEXTER | |
In the text
![\begin{figure}
\par\includegraphics[width=8.8cm,clip]{lsidoli_fig3.ps} \end{figure}](/articles/aa/full/2005/03/aagj152/img24.gif) |
Figure 3: R-band image of the error region of AX J161929-4945 obtained from the ESO-R survey scanned on the Precision Measuring Machine at the US Naval Observatory, Flagstaff Station. The circle has a radius of 1'. North is to the top, East to the left. The brightest star in the error circle is HD 146628 (V=10.08). |
| Open with DEXTER | |
In the text
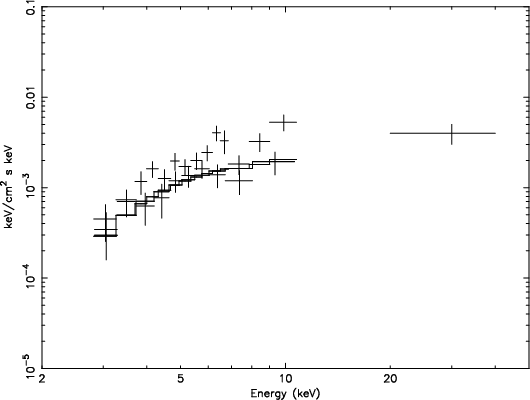 |
Figure 4: Broad band Ef(E) spectrum obtained with the ASCA best-fit together with the IBIS/ISGRI flux measured for IGR J16195-4945 in the energy band 20-40 keV (see Table 2). |
| Open with DEXTER | |
In the text