 |
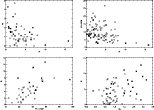
Figure 1:
The most significant non-trivial correlations (see text).
p0 is the debiased broad-band optical polarization (in %), DI is the detachment index
(unitless), C IV HREW is the rest equivalent width of the red part of the C IV BEL (in Å), BI is the balnicity index (in
|
| Open with DEXTER | |
In the text
![\begin{figure}
\par\includegraphics[width=8cm,clip]{1066fg2.ps}\end{figure}](/articles/aa/full/2004/43/aa1066/Timg64.gif) |
Figure 2:
Distribution of the 30 BAL QSOs with respect to PC1 and PC2. Open squares represent HI BAL QSOs, filled squares LI BAL QSOs while the cross represents the only unclassified BAL QSO considered in the PCA. Large symbols refer to bright QSOs with
|
| Open with DEXTER | |
In the text
 |
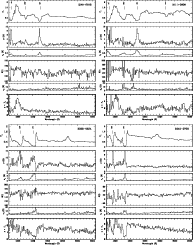
Figure 3:
Spectropolarimetric data for the BAL QSOs B1246-0542 ( top
left), B1011+0906 ( top right), B2225-0534 ( bottom left) and
B2240-3702 ( bottom right). For each object, there are six
panels; from top to bottom: total flux
|
| Open with DEXTER | |
In the text
 |
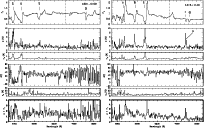
Figure 4:
Spectropolarimetric data for the BAL QSOs B1331-0108
( left) and B1413+1143 ( right). Panels are as in
Fig. 3. The B300 and R300 spectra were cut on
their reddest and bluest parts respectively and merged together at the
wavelength indicated by the vertical dashed line. The main absorption
lines are indicated as well as features due to cosmic rays hits. The
asterisk in the spectrum of B1413+1143 indicates an intervening
absorption system at
|
| Open with DEXTER | |
In the text
![\begin{figure}
\par\includegraphics[width=8.8cm,clip]{1066fg5.ps}\end{figure}](/articles/aa/full/2004/43/aa1066/Timg89.gif) |
Figure 5: The correlation between the maximum value of the polarization in the C IV absorption line and the balnicity index BI. Open squares are HIBAL QSOs, filled squares are LIBAL QSOs and crosses are unclassified BAL QSOs. The open circle corresponds to an uncertain measurement (see text). |
| Open with DEXTER | |
In the text
![\begin{figure}
\par\includegraphics[width=8.8cm,clip]{1066fg6.ps}\end{figure}](/articles/aa/full/2004/43/aa1066/Timg90.gif) |
Figure 6: The correlation between the polarization degrees in the C IV and C III] emission lines relative to the polarization in the adjacent redward continuum. The dashed line refers to an equal polarization in the two lines. Symbols are identical to those used in Fig. 5. |
| Open with DEXTER | |
In the text
![\begin{figure}
\par\includegraphics[width=8.8cm,clip]{1066fg7.ps}\end{figure}](/articles/aa/full/2004/43/aa1066/Timg91.gif) |
Figure 7: The correlation between the detachment index DI and SI, the ratio of the C IV absorption depths in the polarized flux and in the total flux. Both quantities are unitless. Symbols are identical to those used in Fig. 5. The open circle corresponds to an uncertain measurement (see text). |
| Open with DEXTER | |
In the text
| |
Figure 8: Schematic illustration of the SI-DI relationship. The equatorial wind, represented by the curved streamlines, emerges from a geometrically thin accretion disk located in the equatorial plane. A mirror of electrons is located in the polar region and scatters some radiation coming from the central regions along the line-of-sight. This polarized component is then subsequently absorbed in the equatorial wind. When the disk is seen edge-on, P Cygni type profiles are observed since the observer sees absorption at all velocities including the low ones near the disk. For less inclined line-of-sights, detached absorption profiles are observed since the observer misses the low velocity part of the absorption. |
| Open with DEXTER | |
In the text