![\begin{figure}
\par\includegraphics[width=8.8cm,clip]{1333fig2.eps}\end{figure}](/articles/aa/full/2004/42/aa1333/img29.gif) |
Figure 2: Internal errors of magnitude and colours as a function of the apparent visual magnitude, V, for all stars in the cluster region. The structure in the magnitude dependence is owed to the mosaic of images from different nights and different telescopes having different limiting magnitude. |
| Open with DEXTER | |
In the text
![\begin{figure}
\par\includegraphics[width=16cm,clip]{1333fig3.eps}\end{figure}](/articles/aa/full/2004/42/aa1333/img36.gif) |
Figure 3: The colour-magnitud diagram of the NGC 1817 area. Empty circles in the right figure are the astrometric members from Paper II. Black line is a shifted ZAMS, with the chosen margin for candidate members (V+0.5,V-1) in white lines. See text for details. |
| Open with DEXTER | |
In the text
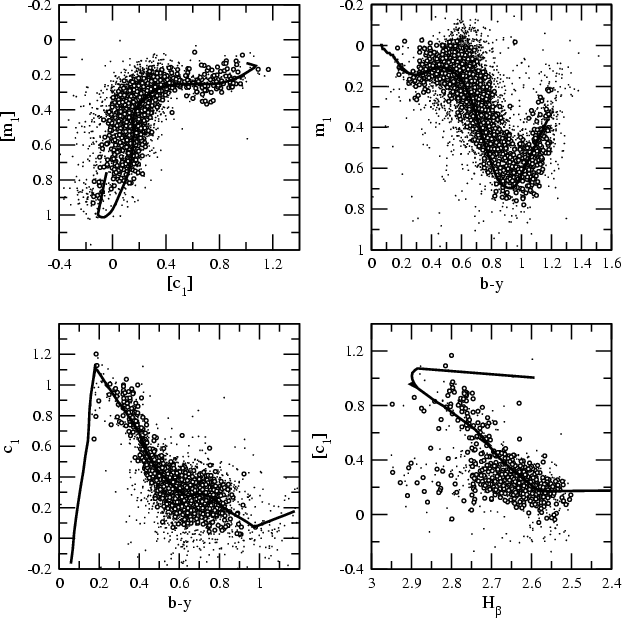 |
Figure 4: The colour-colour diagrams of NGC 1817. Empty circles denote candidate members of NGC 1817, chosen with astrometric and non-astrometric criteria as explained in Sect. 3.1. The thick line is the standard relation shifted E(b-y) = 0.19 when necessary. |
| Open with DEXTER | |
In the text
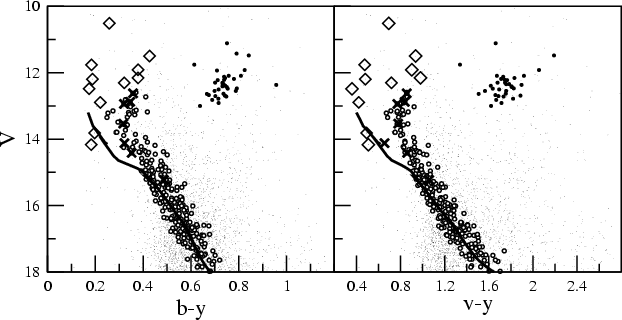 |
Figure 5:
Colour-magnitude diagram with the subset of 264 stars used to
derive the physical parameters in empty circles, the
red giants in full circles,
blue stragglers in diamonds and |
| Open with DEXTER | |
In the text
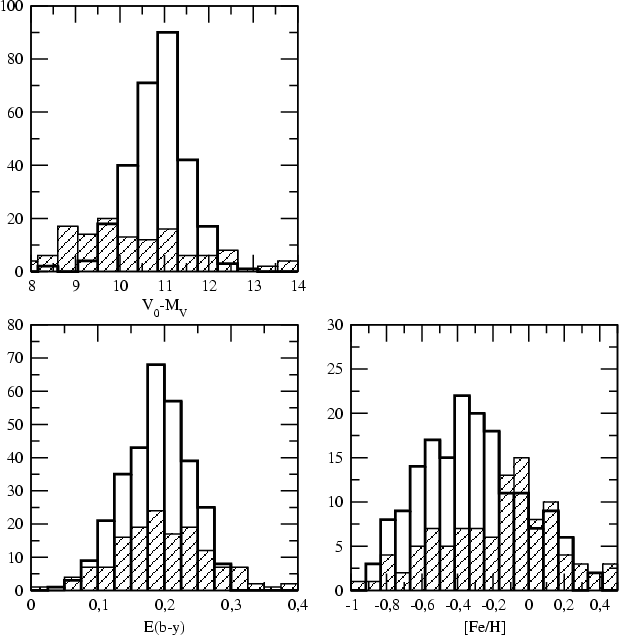 |
Figure 6: The histograms of the distance modulus, reddening and metallicity of the selected member stars of NGC 1817 (white), and the corresponding ones for the stars in the NGC 1807 area (dashed). |
| Open with DEXTER | |
In the text
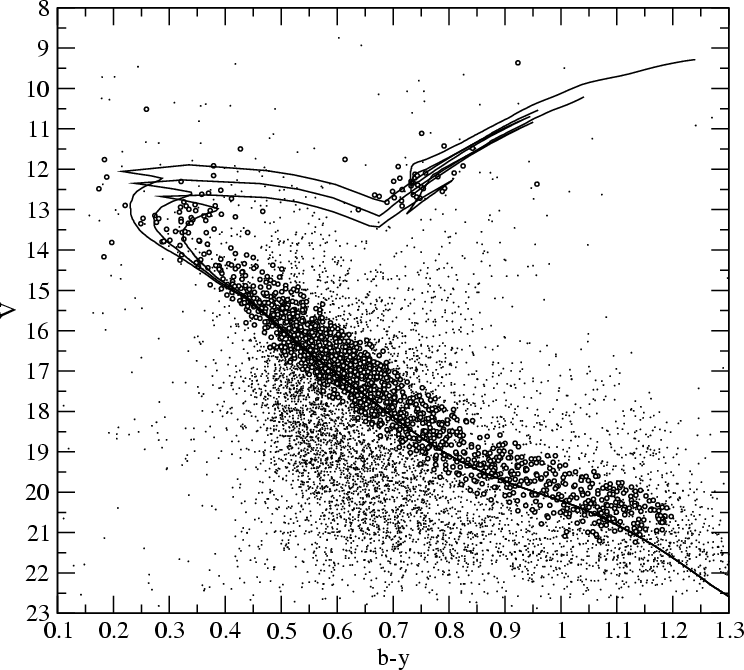 |
Figure 7:
Geneva isochrones (Schaerer et al. 1993)
of |
| Open with DEXTER | |
In the text
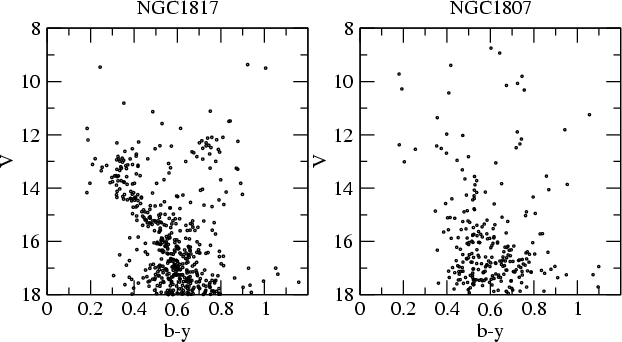 |
Figure 8:
The colour-magnitude diagram of stars in an area of 15
|
| Open with DEXTER | |
In the text
![\begin{figure}
\par\includegraphics[width=14cm,clip]{1333fig1.eps}\end{figure}](/articles/aa/full/2004/42/aa1333/img61.gif) |
Figure 1: Finding chart of the area under study. The resulting area of the mosaic of images for each telescope is marked in black on an image of a plate plotted with Aladin. |
| Open with DEXTER | |
In the text