![\begin{figure}
\par\includegraphics[width=8cm,clip]{1204fg4a.ps}\hspace*{5mm}
\includegraphics[width=8cm,clip]{1204fg4b.ps}\end{figure}](/articles/aa/full/2004/41/aa1204/Timg61.gif) |
Figure 4:
Polarization images of the Southern lobe of the source
B3-1343+386 at 5.0 GHz ( left) and 8.4 GHz ( right). The
vectors superimposed on the I contours show the percentage
polarization and the position angle of the |
| Open with DEXTER | |
In the text
![\begin{figure}
\par\includegraphics[width=8.8cm,clip]{aa1204f5.eps}\end{figure}](/articles/aa/full/2004/41/aa1204/Timg66.gif) |
Figure 5:
Polarization image of the Westernmost region of the source
B3-2304+377 at 5.0 GHz. The
vectors superimposed on the I contours show the percentage
polarization and the position angle of the |
| Open with DEXTER | |
In the text
![\begin{figure}
\par\includegraphics[width=16.4cm,clip]{aa1204f6.eps}\end{figure}](/articles/aa/full/2004/41/aa1204/Timg67.gif) |
Figure 6: Examples of spectral fits in the lobes (JP model), hot spot (power law) and core (inverted spectrum) of B3-0147+400 ( left) and B3-2358+406 ( right). The values of the local spectral indices are reported in the spectrum of each component. The green line connects the flux density measurements, while the blue line represents the best fit to the spectrum. No fit has been attempted for the core region in both sources. |
| Open with DEXTER | |
In the text
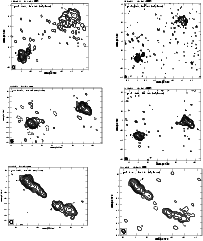 |
Figure 1: VLBA images at 5.0 (left) and 8.4 (right) GHz. For each image we give the following information on the plot itself: a) Peak flux density in mJy/beam; b) First contour intensity ( f.c., again in mJy/beam), which is generally = 3 r.m.s. of the noise; contour levels increase by a factor of 2; c) The restoring beam is plotted on the bottom left corner of each image. |
| Open with DEXTER | |
In the text
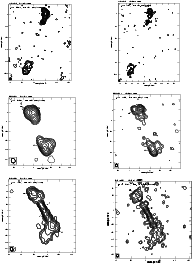 |
Figure 1: Continued. |
| Open with DEXTER | |
In the text
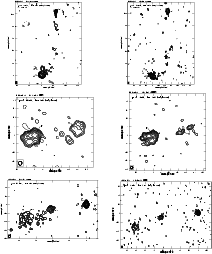 |
Figure 1: Continued. |
| Open with DEXTER | |
In the text
 |
Figure 1: Continued. |
| Open with DEXTER | |
In the text
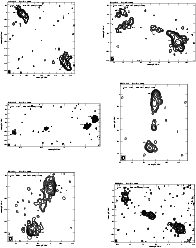 |
Figure 2: VLBA images of the sources observed at 5.0 GHz only. For each image we give the following information on the plot itself: a) Peak flux density in mJy/beam; b) First contour intensity (f.c., in mJy/beam), which is generally 3 times the r.m.s. noise on the image plane; contour levels increase by a factor of 2; c) The restoring beam is plotted on the bottom left corner of each image. |
| Open with DEXTER | |
In the text
 |
Figure 2: Continued. |
| Open with DEXTER | |
In the text
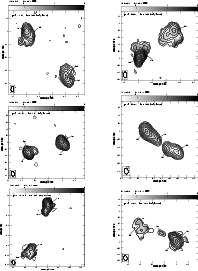 |
Figure 3:
VLBA spectral images between 1.67 and 5.0 GHz.
For each spectral index distribution image we provide the following
information on the plot itself:
a) Peak flux density and first contour (f.c.), in
mJy/beam at 5 GHz, corresponding to 3 times the off-source noise on
the image plane; contours increase by a factor 2;
b) Beam size, represented by the ellipse in the lower left corner;
c) Grey-scale range of the spectral index 1.5> |
| Open with DEXTER | |
In the text
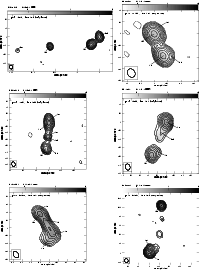 |
Figure 3: Continued. |
| Open with DEXTER | |
In the text
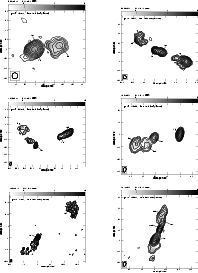 |
Figure 3: Continued. |
| Open with DEXTER | |
In the text