![\begin{figure}
\par\includegraphics[width=8cm,clip]{0295f1.ps}
\end{figure}](/articles/aa/full/2004/30/aa0295-04/Timg128.gif) |
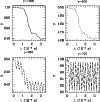
Figure 1:
Values for which
|
| Open with DEXTER | |
In the text
![\begin{figure}
\par\includegraphics[width=7.8cm,clip]{0295f2a.ps} \includegraphics[width=7.8cm,clip]{0295f2b.ps}
\end{figure}](/articles/aa/full/2004/30/aa0295-04/Timg162.gif) |
Figure 2:
Wavefronts (dotted lines) and level curves at e-n of the maximum
amplitude of the Gaussian mode (solid lines,
n = 1, 2, ...);
top: near-field, bottom: far-field. z is in units of z0 and |
| Open with DEXTER | |
In the text
In the text
In the text
In the text
![\begin{figure}% latex2html id marker 838\par\includegraphics[width=8.4cm,clip]...
...ntlabel {\csname p@figure\endcsname \csname thefigure\endcsnamed}
\end{figure}](/articles/aa/full/2004/30/aa0295-04/Timg222.gif) |
Figure 3d:
Run 1: time development of average Lorentz
factor (i.e. per
macro-particle) in two simulations, one with N=2 ( top) and the other
with N=200 ( bottom). The N=2 case reflects the
behaviour of particles radiating incoherently, with constant energy
loss over time as compared with the bunching case, where
there is a steep drop in energy (
|
In the text
![\begin{figure}% latex2html id marker 853\par\includegraphics[width=8cm,clip]{0...
...entlabel {\csname p@figure\endcsname \csname thefigure\endcsnamea}
\end{figure}](/articles/aa/full/2004/30/aa0295-04/Timg223.gif) |
Figure 4a:
Spectra for Run 2 plotted over
each other; we have K = 5 (solid), 10 (dotted), 15 (short-dashed) and 20 (long-dashed). The resonance frequency shifts according to Eq. (7). The bandwidth increases with increasing
|
In the text
![\begin{figure}% latex2html id marker 860\par\includegraphics[width=8cm,clip]{0...
...entlabel {\csname p@figure\endcsname \csname thefigure\endcsnameb}
\end{figure}](/articles/aa/full/2004/30/aa0295-04/Timg224.gif) |
Figure 4b: Pulse power for run 2 plotted for different K. The maximum scales roughly as K-2. |
In the text
![\begin{figure}% latex2html id marker 866\par\includegraphics[width=8cm,clip]{0...
...ntlabel {\csname p@figure\endcsname \csname thefigure\endcsnamec}
\end{figure}](/articles/aa/full/2004/30/aa0295-04/Timg226.gif) |
Figure 4c:
Run 2: (
|
In the text
In the text
In the text
![\begin{figure}% latex2html id marker 935\par\includegraphics[width=8cm,clip]{0...
...ntlabel {\csname p@figure\endcsname \csname thefigure\endcsnamec}
\end{figure}](/articles/aa/full/2004/30/aa0295-04/Timg244.gif) |
Figure 5c:
Run 3: the average Lorentz factor of the
macro-particles during
their passage in the cavity for
|
In the text
![\begin{figure}% latex2html id marker 984\par\includegraphics[width=8cm,clip]{0...
...ntlabel {\csname p@figure\endcsname \csname thefigure\endcsnamea}
\end{figure}](/articles/aa/full/2004/30/aa0295-04/Timg256.gif) |
Figure 6a:
Run 4: spectrum for
|
In the text
![\begin{figure}% latex2html id marker 990\par\includegraphics[width=8cm,clip]{0...
...ntlabel {\csname p@figure\endcsname \csname thefigure\endcsnameb}
\end{figure}](/articles/aa/full/2004/30/aa0295-04/Timg257.gif) |
Figure 6b:
Pulse power for run 4 plotted for different
|
In the text
![\begin{figure}% latex2html id marker 996\par\includegraphics[width=8cm,clip]{0...
...entlabel {\csname p@figure\endcsname \csname thefigure\endcsnamec}
\end{figure}](/articles/aa/full/2004/30/aa0295-04/Timg258.gif) |
Figure 6c:
Run 4: the average Lorentz factor versus the average
distance z of the
particles in simulations with changing
|
In the text
In the text
![\begin{figure}% latex2html id marker 1042\par\includegraphics[width=8cm,clip]{...
...entlabel {\csname p@figure\endcsname \csname thefigure\endcsnameb}
\end{figure}](/articles/aa/full/2004/30/aa0295-04/Timg271.gif) |
Figure 7b: Pulse power (logarithmic) for Run 5. The power of the radiation becomes smaller for B0 = 0.025 and 0.05 T. |
In the text
![\begin{figure}% latex2html id marker 1047\par\includegraphics[width=8cm,clip]{...
...ntlabel {\csname p@figure\endcsname \csname thefigure\endcsnamec}
\end{figure}](/articles/aa/full/2004/30/aa0295-04/Timg274.gif) |
Figure 7c:
Run 5: the average Lorentz factor versus the average
distance z of the
particles in simulations with background magnetic field
for
|
In the text
![\begin{figure}% latex2html id marker 1063\par\includegraphics[width=8cm,clip]{...
...entlabel {\csname p@figure\endcsname \csname thefigure\endcsnamea}
\end{figure}](/articles/aa/full/2004/30/aa0295-04/Timg275.gif) |
Figure 8a:
Run 6: spectrum (from top to bottom) for
|
In the text
![\begin{figure}% latex2html id marker 1072\par\includegraphics[width=8cm,clip]{...
...entlabel {\csname p@figure\endcsname \csname thefigure\endcsnameb}
\end{figure}](/articles/aa/full/2004/30/aa0295-04/Timg276.gif) |
Figure 8b:
Pulse power for Run 6 plotted for different number densities relative to
|
In the text
![\begin{figure}% latex2html id marker 1078\par\includegraphics[width=8cm,clip]{...
...entlabel {\csname p@figure\endcsname \csname thefigure\endcsnamec}
\end{figure}](/articles/aa/full/2004/30/aa0295-04/Timg278.gif) |
Figure 8c:
Run 6: from top to bottom: Average Lorentz factor per
particle, for number density of the bunch n = 0.1, 0.2,
0.3,
|
In the text
 |
Figure 9a:
Run 7: spectrum for initial Lorentz factor
of the beam particles
|
In the text
![\begin{figure}% latex2html id marker 1090\includegraphics[width=8.6cm,clip]{0...
...rentlabel {\csname p@figure\endcsname \csname thefigure\endcsnameb} \end{figure}](/articles/aa/full/2004/30/aa0295-04/Timg280.gif) |
Figure 9b: Pulse power for run 7 plotted. |
In the text
 |
Figure 9c: Run 7: the average Lorentz factor versus the average distance z of the particles in simulations with changing Lorentz factor. |
In the text
![\begin{figure}% latex2html id marker 792\par\includegraphics[width=8cm,clip]{0...
...ntlabel {\csname p@figure\endcsname \csname thefigure\endcsnamea}
\end{figure}](/articles/aa/full/2004/30/aa0295-04/Timg210.gif)
![\begin{figure}% latex2html id marker 807\par\includegraphics[width=8cm,clip]{0...
...ntlabel {\csname p@figure\endcsname \csname thefigure\endcsnameb}
\end{figure}](/articles/aa/full/2004/30/aa0295-04/Timg212.gif)
![\begin{figure}% latex2html id marker 824\par\includegraphics[width=8.4cm,clip]...
...ntlabel {\csname p@figure\endcsname \csname thefigure\endcsnamec}
\end{figure}](/articles/aa/full/2004/30/aa0295-04/Timg217.gif)
![\begin{figure}% latex2html id marker 923\par\includegraphics[width=8cm,clip]{0...
...ntlabel {\csname p@figure\endcsname \csname thefigure\endcsnamea}
\end{figure}](/articles/aa/full/2004/30/aa0295-04/Timg241.gif)
![\begin{figure}% latex2html id marker 929\par\includegraphics[width=8cm,clip]{0...
...entlabel {\csname p@figure\endcsname \csname thefigure\endcsnameb}
\end{figure}](/articles/aa/full/2004/30/aa0295-04/Timg242.gif)
![\begin{figure}% latex2html id marker 1029\par\includegraphics[width=8cm,clip]{...
...entlabel {\csname p@figure\endcsname \csname thefigure\endcsnamea}
\end{figure}](/articles/aa/full/2004/30/aa0295-04/Timg270.gif)