 |
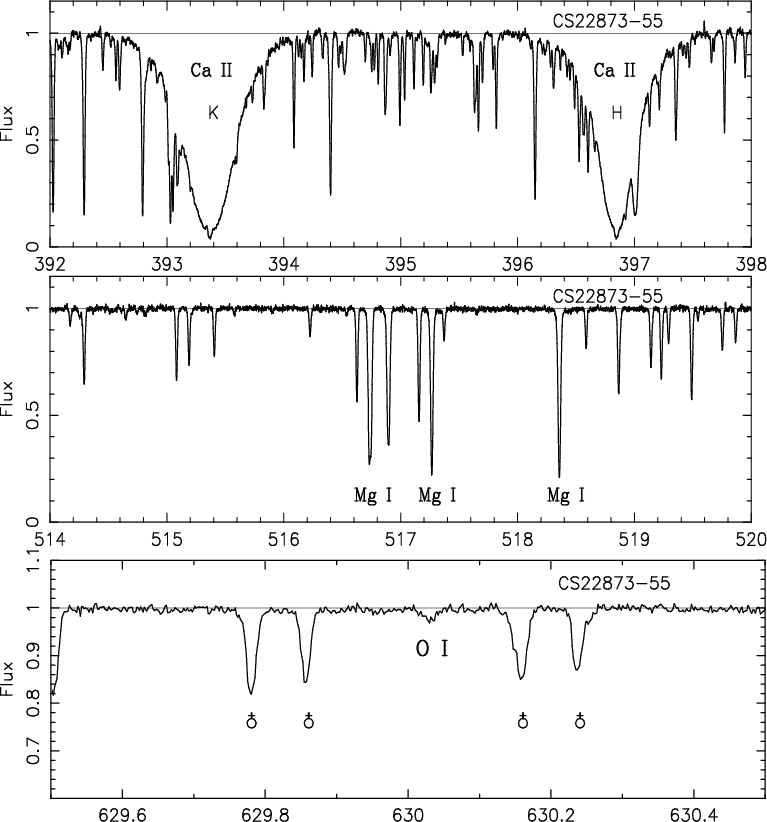
Figure 1: An example of the reduced spectra in the region of the Ca II H and K lines, the Mg I triplet, and in the region of the forbidden oxygen line. The abscissa is the wavelength in nm. Telluric lines are indicated. |
| Open with DEXTER | |
In the text
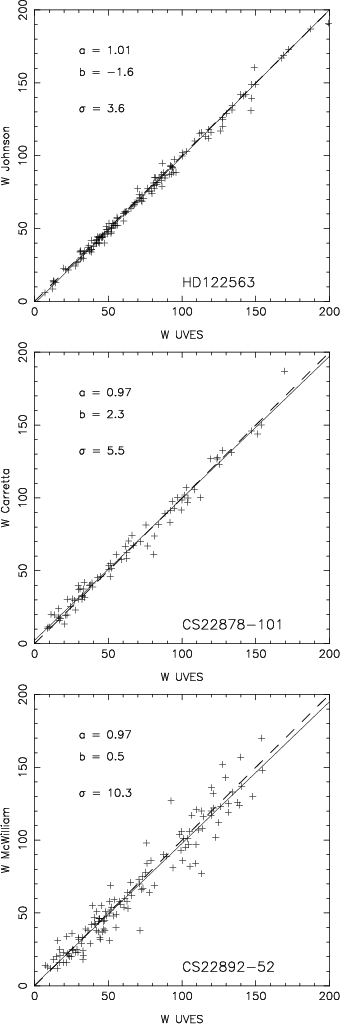 |
Figure 2:
Comparison between our EWs and those of Johnson (2002),
Carretta et al. (2002), and McWilliam et al. (1995).
The one-to-one relation is shown by a dashed line, the mean
curve (least squares) by a full thin line. The value of the slope (a)
and zero point shift (b) of the regression are given, as well as the
standard deviation of the fit ( |
| Open with DEXTER | |
In the text
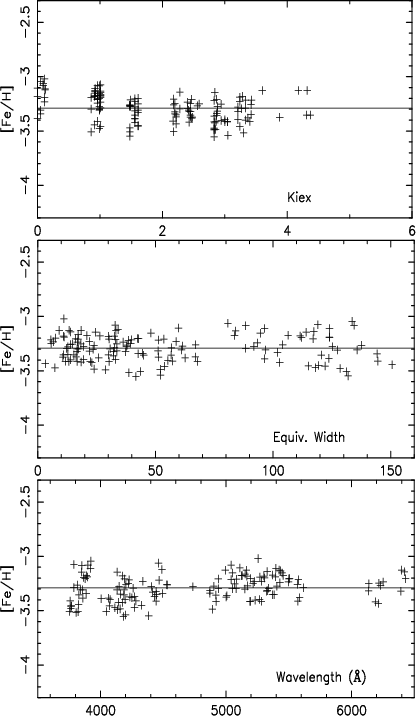 |
Figure 3:
Comparison of FeI abundance for CS 22878-101 vs.
excitation potential, equivalent width, and wavelength. The
parameters adopted for the model are
|
| Open with DEXTER | |
In the text
| |
Figure 4:
[C/Fe] plotted vs. effective temperature.
In the coolest stars (
|
| Open with DEXTER | |
In the text
| |
Figure 5:
[C/Fe] plotted vs. [Fe/H]. The "C-rich'' objects CS 22892-052 and
CS 22949-037 were excluded when computing the regression line. The slope of
the line is not significant; the mean value of [C/Fe] is |
| Open with DEXTER | |
In the text
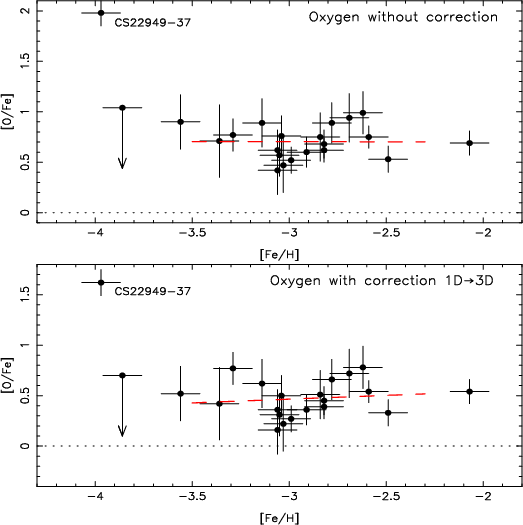 |
Figure 6: [O/Fe] plotted vs. [Fe/H], without and with a correction for stellar surface inhomogeneities (Nissen et al. 2002). The correction is uncertain since it has been computed for dwarfs. The slope of the regression line (dashed) is small and not significant. |
| Open with DEXTER | |
In the text
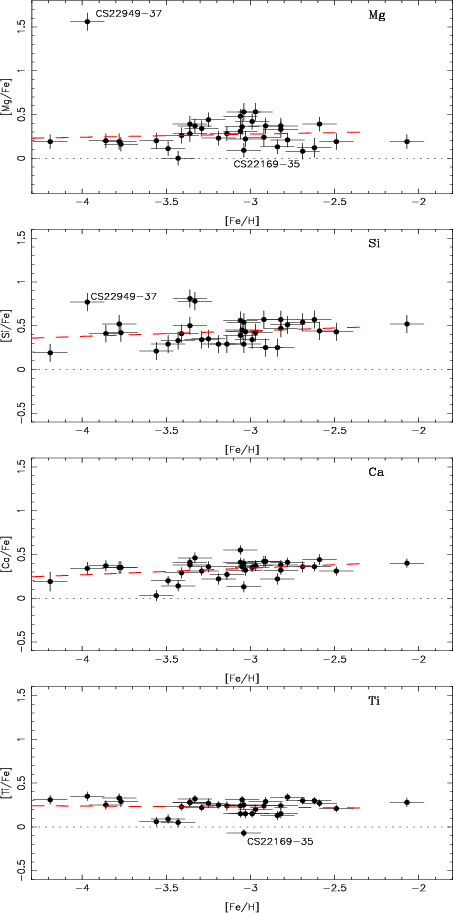 |
Figure 7: [Mg/Fe], [Si/Fe], [Ca/Fe] and [Ti/Fe] plotted vs. [Fe/H]. The peculiar star CS 22949-037 is not included in the computations of the scatter and of the regression line (dashed) for Mg. The star CS 22169-035 is deficient in all the light "even'' elements. |
| Open with DEXTER | |
In the text
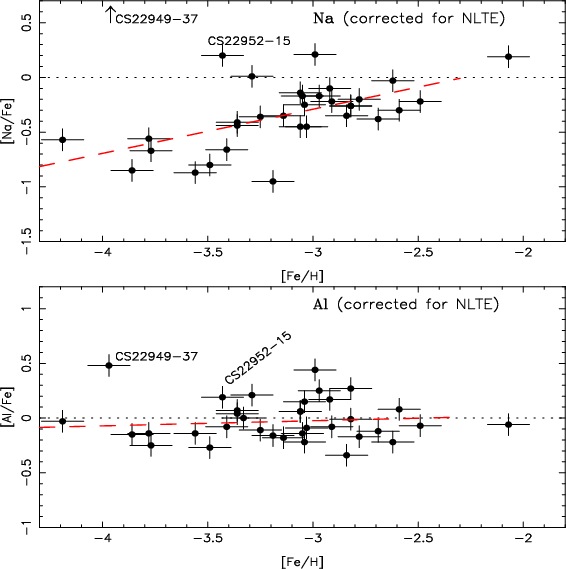 |
Figure 8: [Na/Fe] and [Al/Fe] plotted vs. [Fe/H]. The LTE abundances of these elements have been determined from resonance lines, but corrections for NLTE effects have been applied. |
| Open with DEXTER | |
In the text
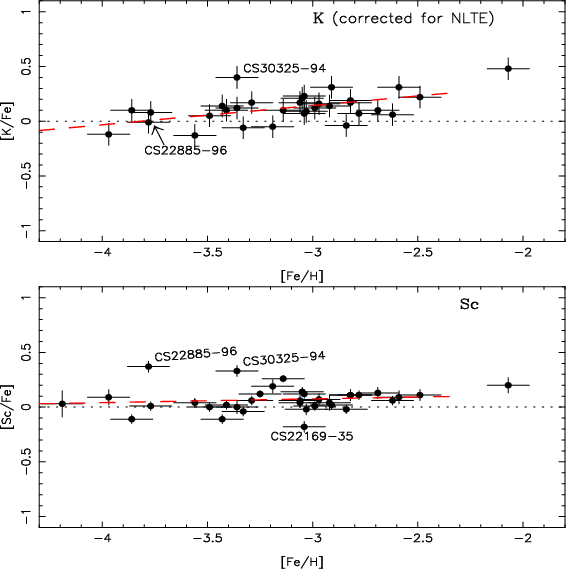 |
Figure 9: [K/Fe] and [Sc/Fe] plotted vs. [Fe/H]. An NLTE correction has been applied to our potassium abundance measurements (see text). |
| Open with DEXTER | |
In the text
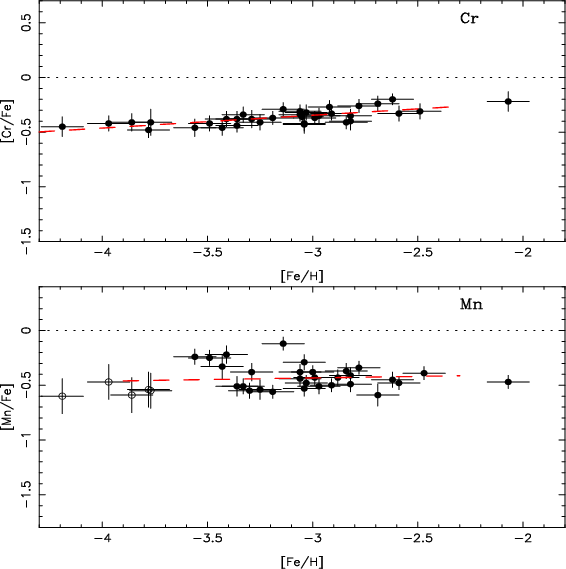 |
Figure 10: [Cr/Fe] and [Mn/Fe] plotted vs. [Fe/H]. For Mn the hyperfine structure has been taken into account, and only the lines with an excitation potential larger than 2.2 have been used. When these lines are too weak (open symbols) the abundance has been deduced from the resonance lines and corrected for a systematic effect. |
| Open with DEXTER | |
In the text
| |
Figure 11: [Cr/Mn] plotted vs. [Fe/H]. The symbols are the same as in Fig. 10. The ratio Cr/Mn is almost constant and close to the solar value. |
| Open with DEXTER | |
In the text
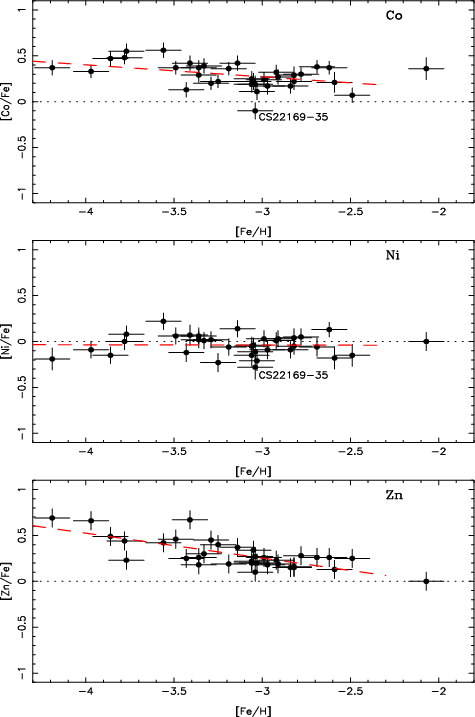 |
Figure 12: [Co/Fe], [Ni/Fe], and [Zn/Fe] plotted vs. [Fe/H]. These ratios increase ([Co/Fe], [Zn/Fe]) or remain essentially constant ([Ni/Fe]) with decreasing metallicity. |
| Open with DEXTER | |
In the text
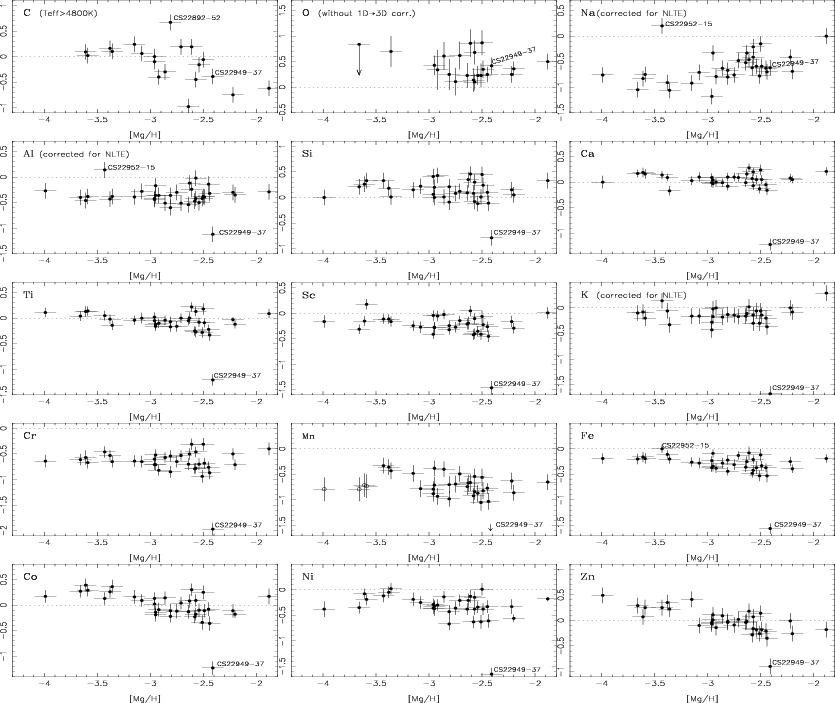 |
Figure 13: Abundance ratios [X/Mg] plotted vs. [Mg/H]. The scale is the same for all the plots: the amplitude in the coordinate [X/Mg] is 2.2 dex. For Mn the symbols are the same as in Fig. 10. |
| Open with DEXTER | |
In the text
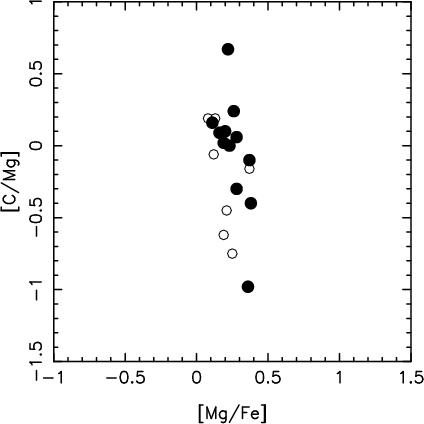 |
Figure 14:
[C/Mg] vs. [Mg/Fe] for all stars of our sample with temperatures
higher than 4800 K (and thus presumably not mixed). Filled circles represent
the most metal-poor stars ([Fe/H] |
| Open with DEXTER | |
In the text
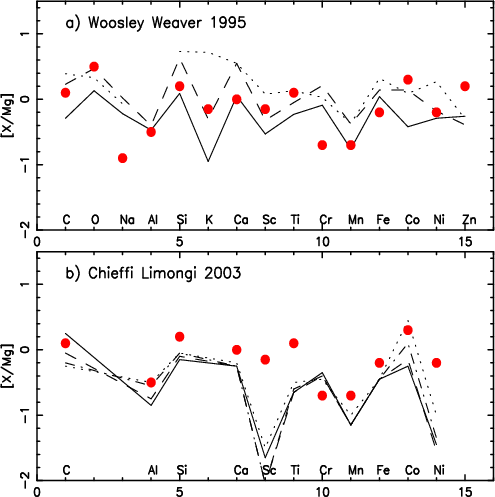 |
Figure 15:
Mean [X/Mg] values for [Mg/H]<-3 (Fig. 7 and Table 10) compared to the model yields by:
a) Woosley & Weaver for 15 (dotted line), 25 (dashed), and 35
|
| Open with DEXTER | |
In the text