 |
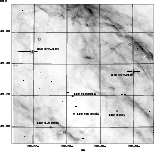
Figure 1:
The field of G 82.2+5.3 in the H |
| Open with DEXTER | |
In the text
 |
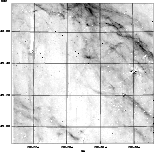
Figure 2:
The [S II] image of the area around G 82.2+5.3. The morphology in these emission lines is similar to that of the H |
| Open with DEXTER | |
In the text
 |
Figure 3:
The medium ionization line of [O III]5007 Å provides the
sharpest view of G 82.2+5.3 ( left).
The image has been smoothed to suppress the residuals
from the imperfect continuum subtraction and the shadings run
linearly from 0 to 30 |
| Open with DEXTER | |
In the text
 |
Figure 4:
The correlation between the [O III] emission and the radio
emission at 326 MHz ( left) and 4850 MHz ( right) is shown in this figure.
The 326 MHz radio contours (Rengelink et al. 1997) scale linearly
from 0.01 Jy/beam to 0.09 Jy/beam, while the 4850 MHz contours scale
from 5 |
| Open with DEXTER | |
In the text
 |
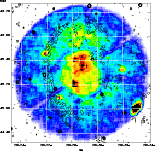
Figure 5:
The raw soft X-ray emission detected in the 8 ks ROSAT pointed
observation is shown in this figure. The brightness scales linearly
from 2 to 24 counts/pixel and the image has been smoothed with a Gaussian
filter with |
| Open with DEXTER | |
In the text
 |
Figure 6: The brightness profile (crosses) of G 82.2+5.3 derived from the ROSAT data is shown in this figure. The open squares mark the exponential best fit with some limb brightening, while the open triangles mark the power-law best fit. The reader is referred to Sect. 4.1 for more details. |
| Open with DEXTER | |
In the text
 |
Figure 7: The ASCA GIS2/3 data are shown in the left figure together with the best fit vmekal model, while the spectra from the SIS detectors are shown in the right figure with the same model (see Sect. 4.2). |
| Open with DEXTER | |
In the text
 |
Figure 8:
Best fit and error contours (1 |
| Open with DEXTER | |
In the text