![\begin{figure}
\par\includegraphics[width=17.1cm,clip]{4120_1.eps}
\end{figure}](/articles/aa/full/2004/03/aa4120/img17.gif) |
Figure 1:
a) and b) SCUBA maps of IRAS2 at 450 and 850 |
| Open with DEXTER | |
In the text
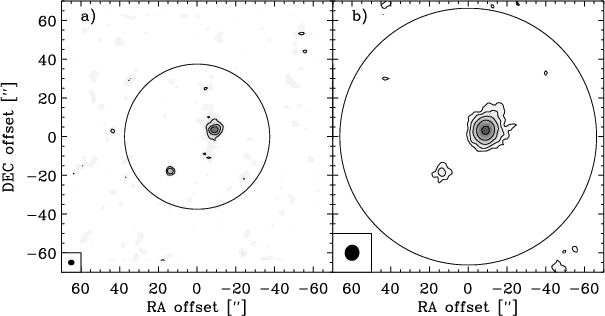 |
Figure 2:
Maps of continuum emission at 86-89 GHz from OVRO a) and
BIMA b). Offsets are with respect to the pointing center of
|
| Open with DEXTER | |
In the text
![\begin{figure}
\par\includegraphics[width=8cm,clip]{4120_3a.eps}\vspace*{4mm}
\includegraphics[width=8cm,clip]{4120_3b.eps}
\end{figure}](/articles/aa/full/2004/03/aa4120/img41.gif) |
Figure 3:
Visibility amplitudes of the observed continuum emission from
the BIMA ( upper panel) and OVRO ( lower panel) observations as a
function of projected baseline length in k |
| Open with DEXTER | |
In the text
![\begin{figure}
\par\includegraphics[width=8.8cm,clip]{4120_4a.eps}\hspace*{2mm}
...
...c.eps}\hspace*{2mm}
\includegraphics[width=8.8cm,clip]{4120_4d.eps}
\end{figure}](/articles/aa/full/2004/03/aa4120/img42.gif) |
Figure 4: Visibility amplitudes of the observed BIMA continuum emission as in Fig. 3 compared to various input models centered at the position of IRAS2A. Upper panels: a) models with changing steepness of the density profile; b) test of different values of the outer radius and inclusion of the interstellar radiation field. Models with an outer radius 3 times larger than the model from Paper I (i.e. 36 000 AU) are shown. Lower panels: c) fit to the inside-out collapse model of Shu (1977) with parameters constrained independently by molecular line observations and SCUBA continuum observations; d) models with changing size of the inner radius. |
| Open with DEXTER | |
In the text
![\begin{figure}
\par\includegraphics[width=7.4cm,clip]{4120_5.eps}
\end{figure}](/articles/aa/full/2004/03/aa4120/img49.gif) |
Figure 5: Temperature profile in the outermost region of the envelope without (solid line) and with (dashed line) contributions from the interstellar radiation field. The dotted line indicates the temperature of 10 K corresponding to the envelope outer radius jorgensen02. |
| Open with DEXTER | |
In the text
![\begin{figure}
\par\includegraphics[width=8.4cm,clip]{4120_6.eps}
\end{figure}](/articles/aa/full/2004/03/aa4120/img51.gif) |
Figure 6: Derived point source flux plotted against size of the inner envelope cavity. |
| Open with DEXTER | |
In the text
![\begin{figure}
\par\includegraphics[width=8.4cm,clip]{4120_7.eps}
\end{figure}](/articles/aa/full/2004/03/aa4120/img52.gif) |
Figure 7:
Changes of the emerging SED due to inclusion of a 200 AU
outer, 0.3 |
| Open with DEXTER | |
In the text
![\begin{figure}
\par\includegraphics[width=8cm,clip]{4120_8.eps}
\end{figure}](/articles/aa/full/2004/03/aa4120/img54.gif) |
Figure 8:
Fits to the SCUBA observations with a inside-out collapse
model with an isothermal sound speed, a, of 0.3 km s-1 and an age of
|
| Open with DEXTER | |
In the text
![\begin{figure}
\par\includegraphics[angle=-90,width=8.8cm,clip]{4120_9.eps}
\end{figure}](/articles/aa/full/2004/03/aa4120/img56.gif) |
Figure 9:
Constraints on the inside-out collapse model derived from the CS and C34S line intensities, assuming CS and C34S abundances of
|
| Open with DEXTER | |
In the text
![\begin{figure}
\par\includegraphics[width=8.2cm,clip]{4120_10a.eps}\hspace*{2mm}...
....eps}\hspace*{2mm}
\includegraphics[width=8.2cm,clip]{4120_10d.eps}
\end{figure}](/articles/aa/full/2004/03/aa4120/img59.gif) |
Figure 10:
Integrated line emission from the BIMA observations for a)
HCN, b) HCO+, c) N2H+ and d) C34S plotted over the 3 mm
continuum maps (grey-scale). The outflow axes have been marked with
straight lines with the red part being solid and blue part being
dashed. For HCN and HCO+ the emission has been integrated over the
red and blue parts of the line (3 to 7 km s-1 and 9 to
13 km s-1) shown as the dashed and solid lines, respectively. For
N2H+ and C34S the total integrated emission is presented,
in the case of N2H+ integrated over the main group of hyperfine
lines. For C34S the contours are presented in steps of 3 |
| Open with DEXTER | |
In the text
![\begin{figure}
\par\includegraphics[width=8.3cm,clip]{4120_11a.eps}\includegraph...
...clip]{4120_11c.eps}\includegraphics[width=8.3cm,clip]{4120_11d.eps}
\end{figure}](/articles/aa/full/2004/03/aa4120/img60.gif) |
Figure 11:
Integrated line emission from the OVRO data, showing a) CS,
b) H13CO+, c) SO and d) CH3OH. CS is integrated over blue
(5 to 9 km s-1; dashed contours) and red (9 to 13 km s-1;
solid contours) parts of the line with contours in steps of 3 |
| Open with DEXTER | |
In the text
![\begin{figure}
\par\includegraphics[width=5.9cm,clip]{4120_12a.eps}\hspace*{2mm}...
....eps}\hspace*{2mm}
\includegraphics[width=5.9cm,clip]{4120_12c.eps}
\end{figure}](/articles/aa/full/2004/03/aa4120/img61.gif) |
Figure 12:
First order moment (velocity) maps of the a) HCN, b) HCO+(BIMA) and c) CS emission (OVRO). Each map has been overplotted with
the total integrated emission in steps of 3 |
| Open with DEXTER | |
In the text
![\begin{figure}
\par\includegraphics[width=7.1cm,clip]{4120_13.eps}
\end{figure}](/articles/aa/full/2004/03/aa4120/img62.gif) |
Figure 13:
The contrast between the N2H+ and SCUBA emission: the
N2H+ emission divided by the 450 |
| Open with DEXTER | |
In the text
![\begin{figure}
\par\includegraphics[width=8.8cm,clip]{4120_14.eps}
\end{figure}](/articles/aa/full/2004/03/aa4120/img63.gif) |
Figure 14: Comparison between the single-dish observations (dark) and corresponding spectra from the interferometer observations restored with the single-dish beam (red). The spectra from the interferometry observations have been scaled by the factors indicated in the upper right corner (factors 5-12) to include all spectra in the same plots. |
| Open with DEXTER | |
In the text
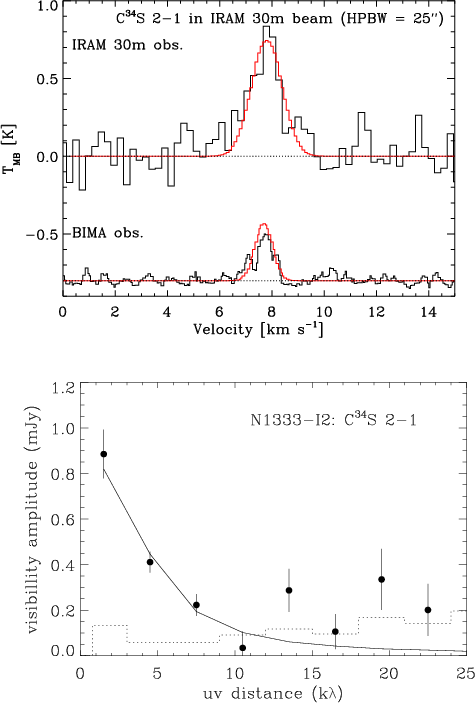 |
Figure 15:
Upper panel: comparison between the C34S emission from the
single-dish observations using the IRAM 30 m telescope with the BIMA
interferometry observations (lower spectrum), offset along the
|
| Open with DEXTER | |
In the text
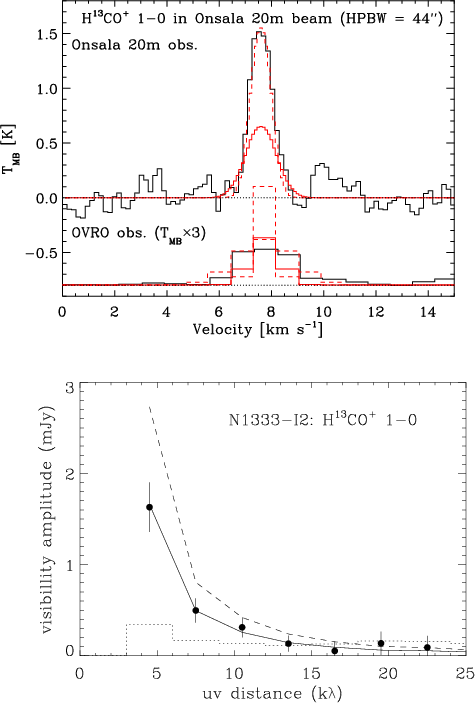 |
Figure 16:
As in Fig. 15, but for H13CO+ emission
as traced by single-dish observations from the Onsala 20m telescope
(44
|
| Open with DEXTER | |
In the text
![\begin{figure}
\par\includegraphics[width=7.8cm,clip]{4120_17.eps}
\end{figure}](/articles/aa/full/2004/03/aa4120/img70.gif) |
Figure 17: Comparison between interferometry observations and envelope model for CS. |
| Open with DEXTER | |
In the text
![\begin{figure}
\par\includegraphics[width=16.7cm,clip]{4120_18.eps}
\end{figure}](/articles/aa/full/2004/03/aa4120/img75.gif) |
Figure 18: Position-velocity diagrams for a) HCN, b) HCO+ and c) CS. The solid line indicates a linear gradient fitted to the centroids for the velocity channel. The hyperfine splitting of HCN is seen as the extension of emission along the velocity axis. |
| Open with DEXTER | |
In the text